
Composition Of The European Parliament In 2019 – Analysis
The composition of the European Parliament during the 2019-24 legislature will comply with all the restrictions established in the Lisbon Treaty. One of them is that there should be degressive proportionality. Yet the stipulation has been broken in both of the last two legislatures (2009-14 and 2014-19). The European Parliament has proposed a composition to the European Council that fulfils degressive proportionality. Hence, the distribution is acceptable, although it can be improved.
By Victoriano Ramírez González, José A. Martínez Aroza and Antonio Palomares Bautista*
The composition of the European Parliament has been decided, historically, via negotiations and agreements. With the object of obtaining a formula that would avoid the need to resort to a new agreement before each election, in 2011 the MEP Andrew Duff –with the cooperation of Professor Geoffrey Grimmett of Cambridge University– began to look for an appropriate formula for the distribution of seats. As a result, a group of researchers specialising in electoral systems (including seven mathematicians and a political scientist) drafted a report1 known in the EP as the ‘Cambridge compromise’. This compromise formula fulfils all the stipulations established in the Lisbon Treaty. However, the proposal was not accepted because many countries would have lost representation if it had been applied in 2014.
At the end of 2016 the Constitutional Commission of the European Parliament (the AFCO) requested three reports from European mathematicians to come up with new formulas for the distribution of EP seats. These reports2 3 were debated and defended in the presence of the EP’s Constitutional Commission and their authors continued to work towards perfecting the proposed formulas, given that some Euro deputies proposed a new stipulation that ‘no State be forced to lose representation in 2019’ (in addition to guaranteeing the existing stipulations of the Lisbon Treaty).
It is possible to meet this stipulation (along with the others established in the Lisbon Treaty) because of the availability of the 73 seats of the UK that are being vacated as a result of Brexit. Some of these seats could be used to correct the current underrepresentation of certain States without the need for any other State to lose current representation.
A proposal with 705 seats (27 of them from the UK) that complies with all the stipulations of the Lisbon Treaty and in which no State loses representation was approved on 7 February by the European Parliaments.7 It is therefore an acceptable distribution. Nevertheless, a deeper analysis shows that it could be improved by increasing the representation of three countries: France, Spain and the Netherlands.
Analysis
The Lisbon Treaty (LT), signed in 2009, established a series of restrictions with respect to the composition of the European Parliament (EP). Specifically, the LT states that:
- No State may have more than 96 seats, or less than six.
- The size of the EP should be less than, or equal to, 751 seats.
- The assignment of seats to States should be degressively proportional, such that the most populous States would have fewer representatives than would correspond exactly with their proportion of the total European population, while the least populous States would have more (although a State with more population than another would never have fewer representatives).
Therefore, Malta, the smallest EU country, should have at least six seats, even though it has less than half a million inhabitants. At the same time, Germany, the most populous country of the EU –with more than 82 million people– cannot have more than 96 representatives in the EP. Each MEP for Malta represents some 72,000 Maltese citizens, while each German MEP represents more than 854,000 Germans.
This degressive proportionality means that the MEPs from the most populous countries will represent more EU citizens than those from the least populous countries. In particular, when two countries are compared, the ratio between population and the number of seats must be higher for the more populous country. Currently, the 54 MEPs from Spain each correspond to some 860,000 inhabitants, while the 74 French MEPS seats each represent nearly 900,000 French inhabitants. In this way, degressive proportionality does not hold when comparing Germany with France, or Spain. In addition, there are other violations of this degressive proportionality principle.
A simple, transparent and durable formula for the distribution of EP seats was created in Cambridge. Using the 2011 populations cited in Eurostat (and including Croatia), the representation of each country was obtained by assigning an initial five seats to each State, and then another seat for each additional 835,000 inhabitants (or fraction thereof).
If this formula would have been applied, there would be no violation of the principle of degressive proportionality, and Spain would have 61 seats, instead of 54. But under the ‘Cambridge compromise’ formula, the countries of intermediate populations (especially those between 7 and 11 million) would lose significant representation. Therefore, this formula was not accepted for determining the distribution of seats for the period 2014-19.
Many other formulas have also been proposed during the last decade, but none have ultimately been accepted.
One recent formula fits relatively well with the current distribution of seats: it is known as FPS (fixed, proportional and proportional to the square root)4 because it assigns a fixed number of seats to each State (10%), while another group of seats is assigned in proportion to the population of each state (50%), and still another set of seats in proportion to the square root of each State’s population (40%).
The draft version of Report 2017/2054(ILN),5 prepared by Danuta María Hübner and Pedro Silva Pereira (President and Secretary of the AFCO, respectively), for the meeting held in Strasbourg on 11 September 2017, shows that FPS ‘produces interesting results that deserve a deeper analysis and should be considered for the future assignment of seats as of the 2024 elections’.
If FPS had been applied to calculate the composition for 2019 the result would have been very similar to that agreed except for some of the most populated countries.
The agreed composition and the proposed modification
Figure 1 shows, in column 3, the distribution proposed by the EP and in brackets the increase for countries whose representation would be greater than in 2014-19. France, Spain, Italy and the Netherlands are the four countries whose representation would increase the most, and precisely all of them except Italy currently fail to comply with the degressive proportionality stipulated by the LT, since they are very underrepresented.
Column 4 shows the degressivity ratios for the distribution of the EP, that is, the population/seat ratio.
Column 5 shows our proposed modified distribution; it only affects France, Spain and the Netherlands (in bold type).
The last column shows, in bold type, the new degressivity ratios for France, Spain and the Netherlands obtained by increasing their representation; it also shows the ratios for the other most populated countries in order to compare the change in ratio with the change in population from Germany to Belgium.
| Country | P = population | S = seats | P/S | Prop seats | P/Prop |
|---|---|---|---|---|---|
| Germany | 82 064 489 | 96 | 854 838 | 96 | 854 838 |
| France | 66 661 621 | 79 (+5) | 843 818 | 81 | 822 983 |
| Italy | 61 302 519 | 76 (+3) | 806 612 | 76 | 806 612 |
| Spain | 46 438 422 | 59 (+5) | 787 092 | 61 | 761 286 |
| Poland | 37 967 209 | 52 (+1) | 730 139 | 52 | 730 139 |
| Romania | 19 759 968 | 33 (+1) | 598 787 | 33 | 598 787 |
| Netherlands | 17 235 349 | 29 (+3) | 594 322 | 30 | 574 512 |
| Belgium | 11 289 853 | 21 | 537 612 | 21 | 537 612 |
| Greece | 10 793 526 | 21 | 513 977 | 21 | |
| Czech Republic | 10 445 783 | 21 | 497 418 | 21 | |
| Portugal | 10 341 330 | 21 | 492 444 | 21 | |
| Sweden | 9 998 000 | 21 (+1) | 476 095 | 21 | |
| Hungary | 9 830 485 | 21 | 468 118 | 21 | |
| Austria | 8 711 500 | 19 (+1) | 458 500 | 19 | |
| Bulgaria | 7 153 784 | 17 (+1) | 420 811 | 17 | |
| Denmark | 5 700 917 | 14 (+1) | 407 208 | 14 | |
| Finland | 5 465 408 | 14 (+1) | 390 386 | 14 | |
| Slovakia | 5 407 910 | 14 (+1) | 386 279 | 14 | |
| Ireland | 4 664 156 | 13 (+2) | 358 781 | 13 | |
| Croatia | 4 190 669 | 12 (+1) | 349 222 | 12 | |
| Lithuania | 2 888 558 | 11 | 262 596 | 11 | |
| Slovenia | 2 064 188 | 8 | 258 024 | 8 | |
| Latvia | 1 968 957 | 8 | 246 120 | 8 | |
| Estonia | 1 315 944 | 7 (+1) | 187 992 | 7 | |
| Cyprus | 848 319 | 6 | 141 387 | 6 | |
| Luxembourg | 576 249 | 6 | 96 042 | 6 | |
| Malta | 434 403 | 6 | 72 401 | 6 | |
| Total | 445 519 516 | 705 (+27) | 710 |
What countries stand to benefit from the EP’s proposed composition?
Looking at the increase in representation of different countries, it might appear that France and Spain, which each gain five more seats than they currently have, are the ones to benefit the most.
But that is not the case, since throughout the 2014-19 period the two countries were underrepresented, in breach of the LT, because Spain’s current ratio is higher than not only Italy’s but also Germany’s, while the latter has almost double its population; and France has a ratio far above Germany’s, when it ought to have a substantially lower one, more similar to Italy’s.
In fact, in the current 2014-19 period, France ought to have around 79 seats and Spain some 59, with Germany, Italy and Poland retaining those they currently have, because in that case the ratios of these five most heavily populated countries would be:
| Germany | France | Italy | Spain | Poland |
|---|---|---|---|---|
| 854,838 | 843,818 | 839,761 | 787,092 | 744,455 |
These ratios are in accordance with the respective populations. Because, in this case, France’s ratio (843,818) would be somewhat closer to Italy’s (839,761) than to Germany’s (854,838); and Spain’s (787,092) would be somewhat closer to Poland’s (744,455) than to Italy’s, as is the case with the populations (see column 2 in Figure 1).
However, in the proposal agreed by the EP, Italy has not remained with 73 seats nor Poland with 51. Rather, Italy has gained three seats, resulting in 76, and Poland one, resulting in 52.
Hence, it is Italy that has clearly benefitted from the distribution proposed by the EP.
In reality, the ratio of France should be closer to that of Italy than to that of Germany, since the population of France differs less from Italy’s than from Germany’s. France exceeds Italy in only three seats despite having 5.3 million inhabitants more (one seat for almost every 1.8 million people). That is not very reasonable.
At the same time, Spain’s ratio should be much closer to Poland’s, since its population differs less from Poland’s than from Italy’s. A similar reasoning for Belgium, the Netherlands and Rumania indicates that the Netherlands should also have one more seat, as proposed in column 5.
It can be observed that the last column presents a reasonably declining ratio when three States, ordered consecutively by populations, are compared; if the State in the middle has a population much closer to one of them than to the other, then the same should happen with respect to their ratios. This relationship did not hold in the fourth column of Figure 1.
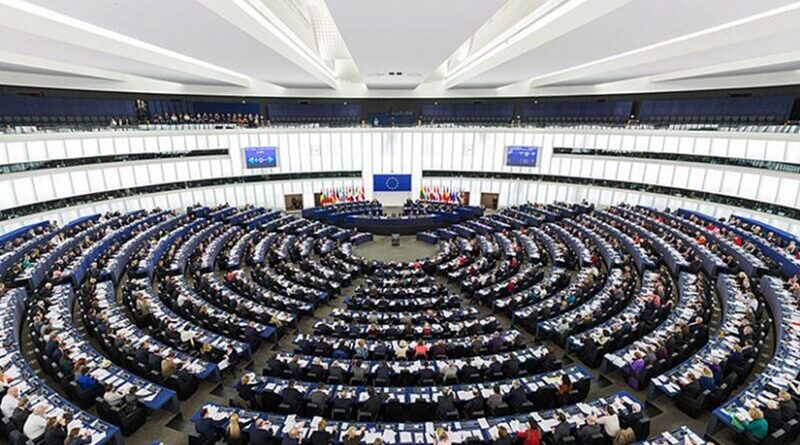
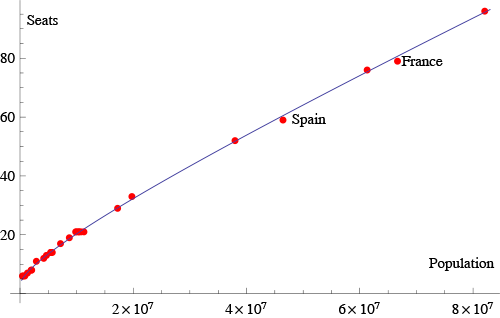
The same conclusion can be reached by looking at various graphical representations. To guarantee degressivity, the points that represent the assigned seats according to each country’s population should show a concave line, or even in extreme cases be in line, especially as regards small groups of countries with consecutive population sizes. It can thus be seen that France and Spain should have more seats.
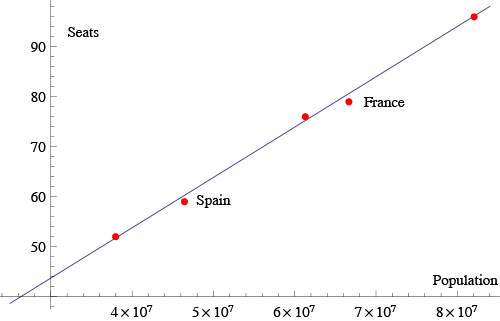
Figure 3 shows France and Spain receiving two additional seats each, to respectively 61 and 81.
In this case, the last five data are practically in line.
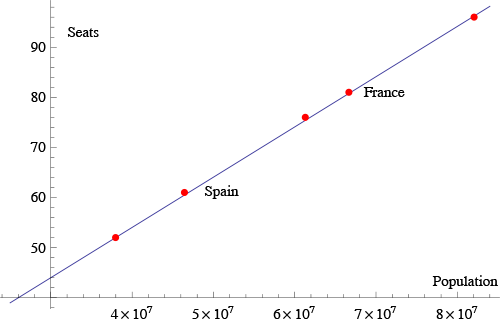
Figures 4 and 5 show the degressivity ratios of the five most heavily populated States compared to their populations, leading to the same conclusion.
It can be seen that Italy causes a change in the line’s slope gradient.
Figure 5 shows the ratios corresponding to the proposed modification.
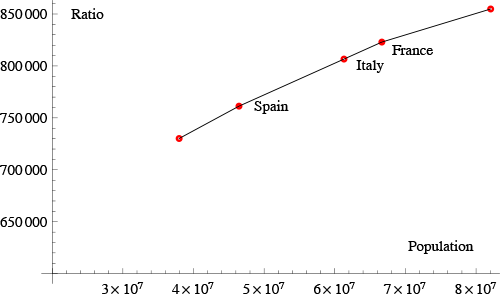
In this case, we see how the slopes decrease gradually the gradient becomes smoother.
Additionally, the increase in one seat for Rumania would take its ratio much closer to that of the Netherlands, despite a difference in population of more 2.5 million. Thus, it would also be fairer to assign the Netherlands with one more seat.
Finally, Figures 6 and 7 show the 27 countries as regards the distribution that has been agreed upon and the proposed modification.
Conclusions
The composition of the two most recent European Parliaments did not meet the requisites established in the Lisbon Treaty with respect to degressive proportionality (DP). For example, during the 2014-19 legislature the ratio of population to seats in France, UK and Spain were all larger than that of Germany, although the opposite should have been the case. Furthermore, the stipulation of degressive proportionality is also unmet among States with intermediate level populations.
The withdrawal of the UK from the EU due to the Brexit referendum allows for the transfer of some of the 73 seats that this country’s departure will free up, with the objective of obtaining a DP distribution for all EU States and furthermore comply with the ‘No Lost Seats’ criterion.
There are thousands of possible solutions when considering more than 705 seats. One way of drastically reducing that number of possibilities is to include some additional criterion, such as a comparison between the populations and ratios of each three consecutive countries in terms of population.
An authentically degressive proportionality should assure that two countries with nearly identical populations should also have nearly identical population to seat ratios, and that two countries with very different populations should also have significantly different ratios. Therefore, when three consecutive countries in terms of population are compared, if the country in the middle has a population very close to that of the least populous country and very different from the most populous one, then the three proportions should verify the same proximity relationship and not the opposite.
This criterion is acceptably complied with by the EP’s proposal for the majority of EU Member States, but that is clearly not the case with France and Spain, given the three-seat increase in Italy’s representation. The two cases could be resolved by assigning two additional seats to France and Spain, while adding a further seat to the Netherlands would also be an improvement. The EP would have 710 seats for 2019. In 2024, when there might possibly be a long-lasting formula to decide on distribution, the EP’s size could be reduced to 700, or 690, or whatever is desired.
Nothing justifies that France and Spain, which were both underrepresented in the previous legislature –since it was negotiated under the criterion that they ‘could not increase their representation in 2014’–, should again be underrepresented in 2019. Even more so on this occasion, in which no State need to see its representation decreased in order for others to have a reasonable assignation.
In any case, AFCO should be congratulated, and especially its Rappoteurs Danuta Hütbner and Pedro Pereira, for having achieved for the first time the compliance with degressive proportionality and for the degree of acceptance achieved for the document approved by the EP.
*About the authors:
Victoriano Ramírez González, José A. Martínez Aroza and Antonio Palomares Bautista Professors at the University of Granada and members of the Grupo de Investigación en Métodos Electorales (GIME)
Source:
This article was published by Elcano Royal Institute
Notes:
1 G.R. Grimmett, J.-F. Laslier, F. Pukelsheim, V. Ramírez González, R. Rose, W. Słomczyński, M. Zachariasen & K. Życzkowski (2011), ‘The Allocation Between the EU Member States of the Seats in the European Parliament – Cambridge Compromise’, Note, European Parliament, Directorate-General for Internal Policies, Policy Department C: Citizen’s Rights and Constitutional Affairs, EP 432,760, March.
2 G.R. Grimmett, F. Pukelsheim, V. Ramírez González, W. Słomczyński & K. Życzkowski (2017), ‘The Composition of the European Parliament’, Workshop 30/I/2017, European Parliament, Directorate-General for Internal Policies, Policy Department C: Citizen’s Rights and Constitutional Affairs, PE 583.117, February.
3 G.R. Grimmett, F. Pukelsheim, V. Ramírez González, W. Słomczyński & K. Życzkowski (2017), ‘A 700-Seat No-Loss Composition for the 2019 European Parliament’, arXiv:1710.03820 [q-fin.EC].
4 V. Ramírez González (2017), ‘The FPS-Method for the Composition of the European Parliament’, unpublished (communicated to the AFCO).
5 D.M. Hübner & P.S. Pereira (2017), ‘Draft Report, on the composition of the European Parliament’, 2017/2054(INL), Committee on Constitutional Affairs.