

‘Peak Trade’ Is Premature – Analysis
By VoxEU.org
It has become consensus to argue that we have approached ‘peak trade’ or the ‘end of globalisation’: that the past five years of stagnant global trade growth are not temporary, but instead reflect persistent forces that are likely to drive a continued stagnation in global trade over the long run. Though this view preceded the Brexit referendum, this column argues that it has now been amplified by the UK’s vote to leave the EU and the prospect that, potentially, US President-elect Trump and other leaders across developed markets will implement protectionist trade policies. The authors consider the arguments for ‘peak trade’, and conclude that, though downside risks to the trade outlook are prominent, there is little evidence – yet – that the current stagnation in global trade is predestined to extend far into the future.
By Ian Tomb and Kamakshya Trivedi*
Over the past five years, global trade growth has been stagnant. With protectionist sentiment intensifying across advanced economies and China and other emerging markets (EMs) appearing to pivot away from export-oriented growth strategies that had incentivised the creation of global supply chains in the 2000s, a hypothesis informally known as ‘peak trade’ has become increasingly popular (Economist 2014). According to this view, the current trade stagnation is not temporary, but instead reflects fundamental changes to the global economy. In the coming decades, these changes will prevent growth in global trade from outpacing growth in global GDP, as it has since World War II. If true, this idea has profound implications. It implies a stoppage, or even a rolling back, of many of the core benefits and costs that have come to define the globalised world, including increased gains from trade, cross-border financial flows and geopolitical interdependence.
Our analysis (Tomb and Trivedi 2016), which we outline here, counters this view. Using a variety of approaches, together with data that allows us to track the paths of nearly 400,000 trade flows over the past 20 years, we push back against three primary variants of the peak trade argument.
Peak trade view #1: A falling ‘trade beta’
First, many economists note that the measured sensitivity of trade growth to income (or GDP) growth has declined in recent years (for example, Escaith and Miroudot 2015). This ‘trade beta’ has fallen from above 2 to near, and even below, 1, the value at which trade simply keeps up with income. Our work suggests, however, that the trade beta—not a clearly-defined structural parameter, and difficult to estimate without bias—may not reliably represent the actual (causal) effect of income growth on trade growth. Shifts in different countries’ relative GDP growth rates, for example, can distort the trade beta in standard cross-country models, creating the impression that income is having a larger or smaller influence on trade.
More generally, the trade beta is not a sufficient statistic for the evolution of global trade. Shifts in the measured trade beta sometimes sit awkwardly with the broader global trade picture. For example, Figure 1 shows that the trade beta—estimated using a standard ‘gravity equation’—declined sharply in the early 2000s, a period of historically rapid trade growth. Moreover, estimating the trade beta with our detailed data set reveals year-to-year changes that are too volatile—including in recent years—to plausibly reflect shifts in meaningful economic relationships.
Figure 1 Shifts in the ‘trade beta’ fit awkwardly with shifts in global trade growth
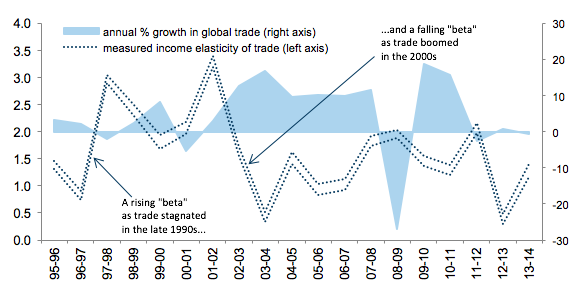
Source: Goldman Sachs Global Investment Research; United Nations Conference on Trade and Development; World Bank.
While we can’t rule out the possibility that the relationship between income and trade has changed over time, we think the evidence is also consistent with a simpler explanation. The causal effect of income growth on trade growth may have stayed roughly stable over time, while other forces—including shifts in the demand for tradeables, changes in trade costs and the availability of trade finance, and the ebbs and flows of protectionist trade policies—have played the starring role in driving global trade over the past two decades, and will continue to do so in the future.
Peak trade view #2: A ‘structural’ trade slowdown
The collapse in global trade growth in 2011 is an example of the influence of other such factors. The slowdown in trade flows across the globe during the US debt ceiling crisis and the euro area sovereign crisis that summer was far more severe than predicted by observable short-run (or ‘cyclical’) drivers, such as a mild slowdown in global GDP growth. This prompted many observers to conclude that ‘structural’ changes—forces operating over very long time horizons, and with the potential to drive trade growth still weaker in coming decades—were, in large part, responsible (Constantinescu et al. 2016). We think the facts sit better with an alternative interpretation: a return to trend. Setting aside the financial crisis years, global trade growth has undergone two major shifts in the past two decades:
- In the early 2000s, annual growth in the value of global trade increased from tepid, but not historically slow rates (1.6% from 1995-2002) to historic double-digit levels (12.5% from 2002-2008).
- Then, in the summer of 2011, trade value growth quickly fell to levels close to zero, where it has remained for the past five years. While clearly low, these growth rates are considerably closer to historical benchmarks than the very high levels of trade growth observed during the 2000s (Figure 2).
Figure 2 The trade boom of the 2000s, not the trade stagnation of the 2010s, is historic
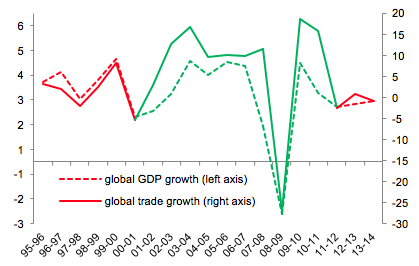
Source: Goldman Sachs Global Investment Research; United Nations Conference on Trade and Development; World Bank.
In sum, the global trade slowdown does not appear to be the beginning, or the middle, of a downward deviation from a 70-year trend of globalisation, but instead marks the end of a decade-long upward deviation from this long-run trend—the trade boom of the 2000s. This is evident not just at the aggregate level, but also when we dig deeper into individual trade flows. For example, Figure 3 shows that the countries that dramatically increased their import growth in the 2000s (such as India and Russia) saw the largest import growth declines in 2011, while countries that experienced a mild acceleration in the 2000s (such as Mexico and the Philippines) saw their import growth rates only mildly affected by the global trade slowdown.
Figure 3 The trade slowdown is, in large part, the end of the 2000s trade boom
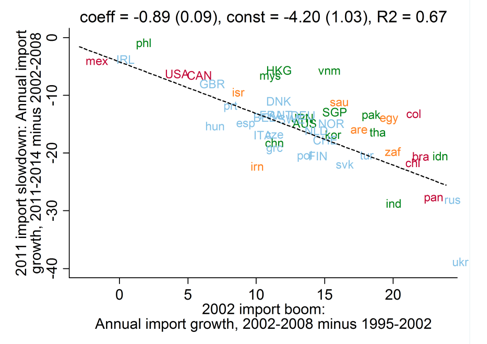
Source: Goldman Sachs Global Investment Research; United Nations Conference on Trade and Development; World Bank.
As Figure 4 makes clear, a similar pattern is also visible at the level of individual goods: those goods that saw the largest increases in the rates by which they were traded in the early 2000s then saw these growth rates fall back to baseline during the global trade slowdown.
Figure 4 Trade in specific goods accelerated in the 2000s, then returned to baseline during the global trade slowdown
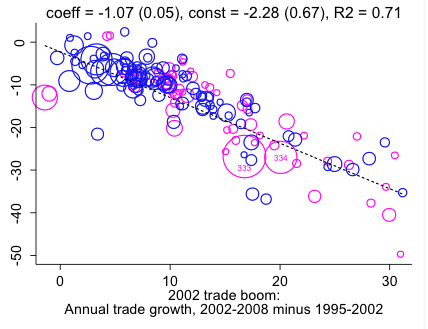
Source: Goldman Sachs Global Investment Research; United Nations Conference on Trade and Development.
Peak trade view #3: A change in the EM growth model
Finally, many observers suggest that, by beginning to turn away from export-led growth models, EMs—and, especially, China—have driven the trade slowdown and may weigh on trade growth further in coming decades.1 We agree that long-run declines in Chinese trade growth likely reflect important and potentially persistent changes to the Chinese economy, and that these changes may impose an important drag on the open economies of Asia in future (for example, China alone accounted for a third of the slowdown of South Korea’s exports during the global trade slowdown).
However, because China and other EMs don’t (yet) account for a large enough share of global trade, their slowing import growth matters less for the global picture than import growth declines in developed markets, particularly in Europe. Europe imports roughly 43% of global traded goods, but accounts for only roughly 20% of global GDP. It represents an important source of external demand for nearly all of the world’s major exporters, and decreased its rate of import growth by slightly more than the global average in 2011. Weighing each country’s import slowdown by its share of global trade (a ‘shift-share’ framework), we find that Europe accounts for roughly half of the global trade slowdown. By contrast, China—which imports a far smaller fraction of global trade, but slowed its rate of import growth at a comparable pace—contributed only 10% (Figure 5).
Figure 5 Europe imports a large share of global trade, and was the key driver of the global trade slowdown
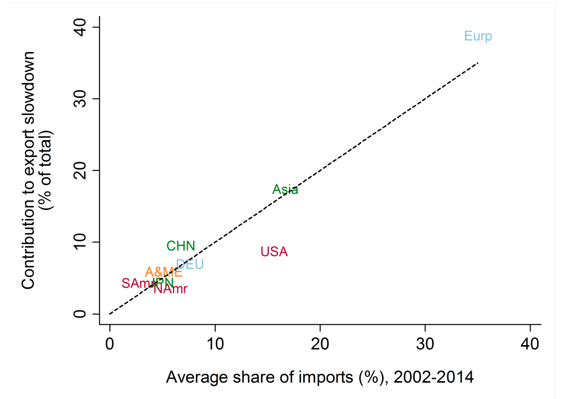
Source: Goldman Sachs Global Investment Research; United Nations Conference on Trade and Development; World Bank.
Downside risks are prominent, but ‘peak trade’ is premature
With the UK voting to leave the EU, US President-elect Trump highlighting his intention to withdraw the US from the Trans-Pacific Partnership, and the potential for political populism to make inroads in continental Europe, the outlook for global trade is uncertain, and the downside risks from policy have risen. While it is easy to get pessimistic about the prospects for trade growth based on recent political news, it is however worth noting that we have seen some progress towards important trade agreements (such as the current negotiations between Japan and the EU), and that some trade flows—including flows sent from key global exporters in Asia (Figure 6)—have quickened in 2016.
Figure 6 Some recent signs of global trade growth—including exports from key Asian countries—have been encouraging
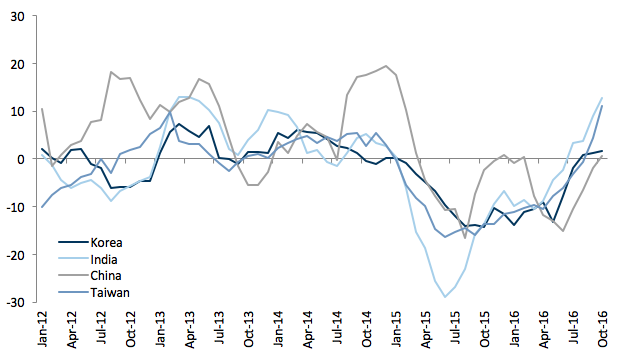
Source: Goldman Sachs Global Investment Research; Haver Analytics.
To sum up, we do not think that the stagnant trade growth of the past five years is more sinister than the typical ebbs and flows associated with shifts in income growth, technological innovations, and policy changes that have driven the growth of global trade since World War II. Though material downside risks to the trade outlook are highly visible at the moment, a conclusion that this represents ‘peak trade’ is, in our view, premature.
About the authors:
*Ian Tomb, Emerging Markets economist, Goldman Sachs
Kamakshya Trivedi, Chief Emerging Markets Macro Strategist, Goldman Sachs
References:
Hoekman, B (ed.) (2015). The global trade slowdown: A new normal? CEPR Press.
Constantinescu, C, A Mattoo and M Ruta (2016). Explaining the global trade slowdown. VoxEU.org, 18 Jan 2015.
The Economist (2014). International trade: A troubling trajectory. Dec 13.
Escaith, H and S Miroudot (2015). World trade and income remain exposed to gravity, in B Hoekman (ed), The global trade slowdown: A new normal? CEPR Press.
Tomb, I. & Trivedi, K. (2016). Pushing back against ‘peak trade’. Goldman Sachs Global Economics Paper 230, available at the Goldman Sachs research portal.
Endnotes
[1] An excellent introduction to these arguments can be found in Hoekman (2015).