
Frequent Volcanic Eruptions Likely Cause Of Long-Term Ocean Cooling
An international team of researchers found an 1800 year-long cooling trend in the surface layer of the Earth’s oceans, and that volcanic eruptions were the likely cause of the cooling from 801 to 1800 AD. The coolest temperatures were during the Little Ice Age – that was before man-made global warming erased the cooling trend in the 1800s.
The research reported by the Past Global Changes’ (PAGES) Ocean2K Working Group in Nature Geoscience indicated that it was likely an increase in the number and size of these eruptions in recent centuries that was the prime cause of the cooling.
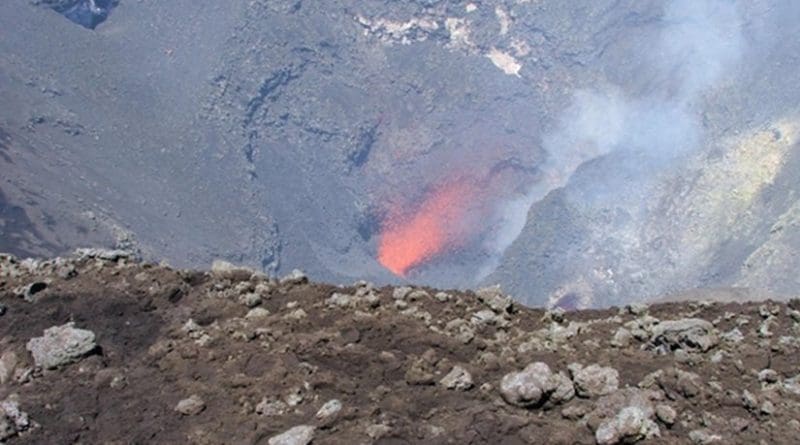
“Volcanic eruptions have a short-term cooling effect on the atmosphere, but our results showed that when volcanic eruptions occurred more frequently, there was long term ocean cooling,” said lead author from the University of Wollongong, Australia, Dr Helen McGregor.
The ocean cooling signal highlights how Earth’s oceans act like a giant flywheel. Compared to the atmosphere, the oceans can absorb much more heat and trap it for longer periods of time. Thus the ocean can buffer short-term changes in global temperature. But when events such as volcanic eruptions cluster together in a relatively short period of time, the temperature changes can become prolonged.
“It’s very important to understand how the oceans have mediated natural forced variations. because compared with the atmosphere, they can absorb an incredible amount of heat. With this research, we now have new insight into the century-scale global sea surface temperature variations that came before man-made greenhouse gas forcing. ” McGregor said.
In an additional finding the researchers discovered that a period of cooling reported on land around the 16th to 18th centuries, known as the Little Ice Age, coincided with ocean cooling, suggesting that this event was a global phenomenon.
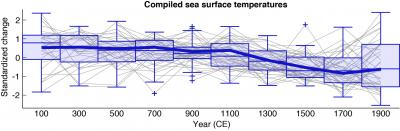
The scientists reached their conclusions by combining, for the first time, 57 previously published and publicly available marine surface temperature reconstructions from across all of the world’s oceans, from near-polar to tropical regions. Data were compiled within 200-year brackets to observe long-term trends.
When they compared the findings to land-based temperature reconstructions and model simulations, Ocean2k independently found a similar cooling to that reported recently by other PAGES groups (PAGES 2k Consortium 2013).
“No matter how we divided the dataset the cooling trend stands out as a robust signal,” said Dr McGregor.
To uncover the cause of the cooling, the researchers turned to climate models. They examined how sea surface temperatures were affected by ‘forcing’ factors, such as changes in solar output, Earth’s orbit, land use, volcanic activity and greenhouse gases. Only volcanic events showed a cooling trend that matched the observations.
According to co-author Associate Professor Michael Evans of the University of Maryland, USA understanding how past forcing factors changed ocean temperatures in the past also opens a window into future climate change.
“Model simulations by others have shown us that the oceans can impart a substantial delay in the warming of the surface climate. With much of the heat from global warming entering our oceans, recent surface ocean warming may foreshadow additional future warming, in the same way as ocean cooling appeared as a long term response to large and frequent volcanic events in recent centuries,” Associate Professor Evans said.
“We are still learning how the oceans mediate climate variations. Further work combining both observations and simulations of ocean climate will refine our understanding of the ocean’s role in climate change.”
Credit
Modified version of Fig 2a in McGregor et al. Nature Geoscience 2015.
PAGES, currently sponsored by Future Earth and the International Geosphere-Biosphere Programme, was established in 1991 to facilitate international paleoenvironmental research and inform strategies for sustainability. It is primarily funded by the Swiss and US national science foundations.