Percentage Of COVID-19 Cases Diagnosed In Spain Rises To Nearly 10% Of The Population Infected
There were at least 2.5-2.7 million accumulated cases of people infected with coronavirus in Spain on April 26 and 600-800,000 cases in Catalonia, according to new research, which notes that the delay between the appearance of symptoms and registration in the official statistics is between 10 to 14 days
A multidisciplinary research group of the Universitat Politècnica de Catalunya · BarcelonaTech (UPC) and the Germans Trias i Pujol Research Institute (IGTP) have analysed the diagnostic delay between the development of symptoms of COVID-19 and the registration of a positive case in ten countries in the European Union.
From this they have been able to calculate the percentage of cases that each country is capable of detecting with respect to the total number of infections; and give a more accurate figure for the real number of cases of COVID-19.
The results of the research indicate that the number of people infected by COVID-19 is still too low to be able to consider the possibility of having achieved herd immunity, that is if it is confirmed that people who have been infected are immunized. It is still not known what percentage of people infected would establish herd immunity for COVID-19, but it should be a minimum of 60%, although some studies suggest it would have to reach 70-75%.
On a positive note, the data show that in both Catalonia and Spain the percentage of diagnoses has risen in the last month going from 5% to 10% of the cases of COVID-19. This is a substantial increase, which is close to the 20-30% reached in Germany or Portugal.
Martí Català of the Germans Trias i Pujol Research Institute and the researcher who led the study explains that “the time between the appearance of symptoms and diagnosis and the capacity to detect the disease vary a lot between different countries because of various factors such as: the reaction of people to the symptoms; the health system structure and the possibility of taking a test; or the time it takes to register cases. This makes it difficult to compare the situations in different countries. Our analysis solves this problem and opens the door to a more rigorous comparative analysis of the situation.”
With the support of the “la Caixa Foundation” the multi-disciplinary team made up of biophysicists and doctors have been working since the start of the pandemic on a mathematical model that allows them to quantify the situation for several countries and regions and make predictions of the developments over the following days.
The researchers point out that once the diagnostic delay is known, in Spain it is approximately two weeks, it is possible to make estimates of the real number of cases and how many will be infectious providing that the real mortality rate of the virus is known.
In the case of Spain, there were around 2.5-2.7 million accumulated cases on April 26, 2.3 million have been diagnosed and the rest will be during next week. Of all these accumulated cases, approximately half a million could pass on the virus.
To make these estimates, the research group has carried out an analysis of the evolution of the percentage of deaths in respect to the reported cases for the different countries and they have compared this with data from tests in the population of South Korea, data from the Diamond Princess cruise ship and the most recent figures from Iceland and Germany.
According to the researchers David Pino and Enrique Alvarez, of the Department of Physics at the UPC who were responsible for carrying out the analysis, the lethality in Europe is about 1%, with maximum variations of 20-30% between countries. “These variations are relatively small compared with the uncertainty associated with knowing exactly how and when different countries are diagnosing,” they explain.
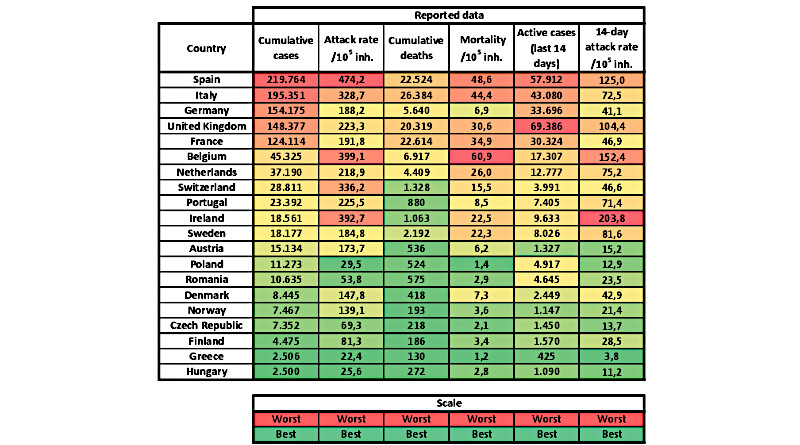
With the exception of Belgium, which includes deaths that are probably not from COVID-19 in the figures for the disease, the rest of the countries report deaths from COVID-19 in a reasonably similar way, following the criteria of the European Centre for the Prevention and Control of Diseases (ECDC). This means that it is possible to compare the real situation from the mortalities in the different countries, over and beyond the first impressions from the data. If we look at the total number of cases (Table 1), Spain and Italy continue in the lead for registered cases.
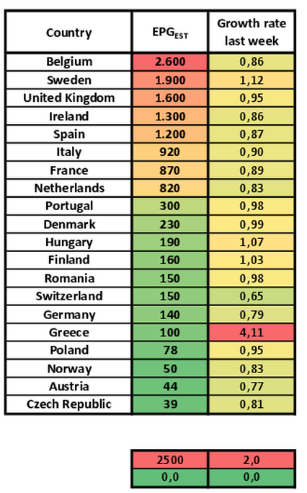
However, the researchers have gone further and analyzed the data from the countries relative to each other. This way they have created an index from previous data and the observed growth of the epidemic, this allows them to classify the countries relatively during the short-term difficulty in controlling the disease and provide the immediate potential of the epidemic. Two students of the Department of Physics Engineering of the UPC, Pablo Palacios and Tomàs Urdiales have participated in elaborating this index.
The index (EPGEST) shows that for countries such as Sweden, which at first glance appear to be doing well, are in fact in much more delicate situation than Portugal. Similarly, the short term situation in Spain is not worse than that of Britain or Sweden and a little better than the Low Countries.
Data for Catalonia
The group have also applied the methodology to Catalonia, and according to the data collected, the estimated incidence of cases is around 6,500 per 100,000 inhabitants, making it the sixth community by incidence. The data show that there are approximately 500,000 – 600,000 accumulated cases in Catalonia, which would reach a million, if the data provided by undertakers was included. Of all the accumulated cases, it has been possible to diagnose 480,000 and the rest will be diagnosed during next week. The delay and the percentage of diagnoses is thought to be similar to the rest of the country: a delay in diagnosis of 10-14 days and a percentage of detection of around 10% of cases of COVid-19 at the moment.
The following table shows the comparison between reported data and the estimated cases that had been diagnosed at April 26 in both absolute and relative numbers (per 100,000 inhabitants).