EIA Releases US West Coast Transportation Fuels Supply/Demand Study – Analysis
By EIA
West Coast or Petroleum Administration for Defense District (PADD) 5 transportation fuels markets are tightly balanced, relatively isolated, and, in some cases, have unique product specifications, which often results in significant and persistent increases in prices in the wake of supply disruptions. On September 30, the U.S. Energy Information Administration (EIA) released the PADD 5 Transportation Fuels Markets study, which examines transportation fuels (motor gasoline, distillate fuel, and jet fuel) supply, demand, and distribution at both the PADD level and for specific areas within PADD 5.
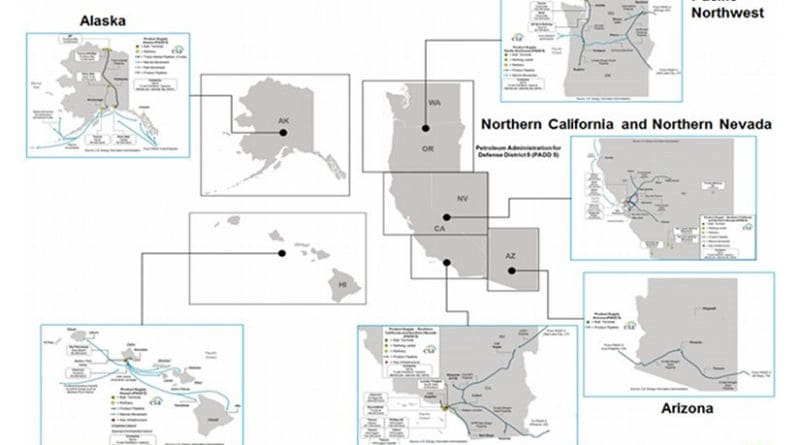
PADD 5 covers a large and diverse geography, and supply/demand balances and distribution patterns vary within the region. The study identified six distinct regional markets within PADD 5: Southern California and Southern Nevada; Northern California and Northern Nevada; Pacific Northwest, which includes Washington and Oregon; Arizona; Hawaii; and Alaska. These six regional markets vary significantly in demand; how transportation fuels are supplied, especially the share of supply provided by in-region refineries; and product distribution patterns (Figure 1 above).
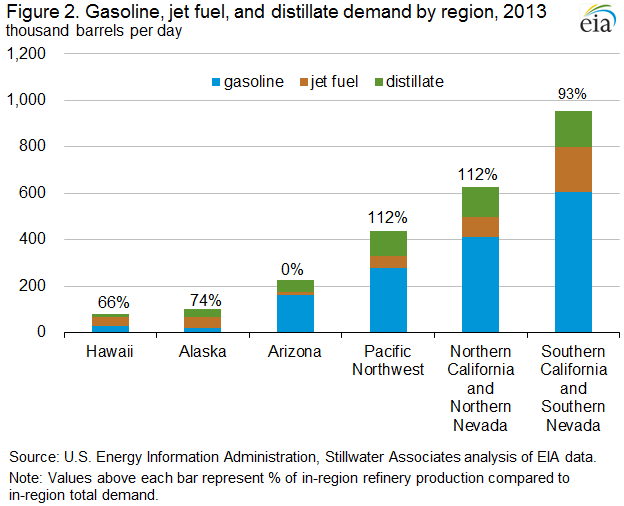
For each of these regional markets as well as for PADD 5 as a whole, the study considers demand, supply sources, transportation logistics, and distribution infrastructure, using 2013 as a base year and taking into account expected changes in balances and infrastructure in subsequent years. Demand includes in-region consumption, transfers of fuels to other parts of the United States (other PADDs) and to other regional markets within PADD 5, and exports to the global market (Figure 2). Supply includes in-region refinery production, receipts of fuels produced in other U.S. regions and other PADD 5 regional markets, and imports. Distribution infrastructure includes storage terminals, pipelines, rail facilities, marine loading and unloading facilities, and marine vessel availability.
Southern California and Southern Nevada
The Southern California and Southern Nevada (SCSN) region includes the southernmost counties of California as well as the Las Vegas metropolitan area of southern Nevada. The region accounts for more than 40% of total PADD 5 motor gasoline demand, and about 7% of total U.S. demand. Because of the many military air bases and large commercial aviation hubs, jet fuel demand in the SCSN region accounts for about 45% of total PADD 5 jet fuel demand and 14% of U.S. demand. SCSN accounts for 32% of total PADD 5 distillate fuel demand, which is about 4% of U.S. demand.
A combination of in-region refinery production, marine-delivered fuels produced at refineries in northern California and Washington state, receipts of fuels produced at refineries in other PADDs, and imports from the global market supply the SCSN region with transportation fuels. The regional refineries do not produce sufficient gasoline or jet fuel to meet in-region demand but produce more distillate than is consumed in the region. In-region refinery production is supplemented with marine deliveries of product from refineries in northern California and Washington state as well as imports from the global market. Transportation fuels produced at SCSN refineries also supply Arizona and some are exported into the global market. Exports are primarily distillate fuel, which might not meet in-region specifications.
Northern California and Northern Nevada
The Northern California and Northern Nevada region (NCNN) includes counties in California north of San Luis Obispo, Kern, and San Bernardino counties, and in Nevada north of Las Vegas. In 2013, with average motor gasoline demand of 412,000 b/d, the region accounted for 27% of total PADD 5 motor gasoline demand and 5% of U.S. motor gasoline demand. NCNN distillate demand of 125,000 b/d in 2013 accounted for 25% of PADD 5 demand and 3% of U.S. demand. NCNN jet fuel demand averaged 88,000 b/d in 2013, 21% of PADD 5 demand and 6% of U.S. demand.
The region is supplied by in-region refinery production, and refineries in the region produce more motor gasoline, jet fuel, and diesel fuel than is consumed in the region. As a result, NCNN supplies other regional markets in PADD 5, primarily SCSN, with motor gasoline, jet fuel, and diesel fuel, and also exports these products. In 2013, the region exported 22,100 b/d of gasoline, 2,300 b/d of jet fuel, and 52,400 b/d of distillate fuel, primarily to Central and South America.
Pacific Northwest
The Pacific Northwest region (PNW) includes the states of Oregon and Washington. In 2013, with 277,300 b/d of motor gasoline demand, the region accounted for 18% of total PADD 5 motor gasoline demand and 3% of total U.S. demand. At 111,400 b/d, PNW demand for distillate fuel was 23% of PADD 5 demand and 3% of U.S. demand. Jet fuel demand in the Pacific Northwest averaged 51,400 b/d in 2013, 12% of PADD 5 demand and 4% of U.S. demand.
The region is supplied by a combination of in-region refinery production, imports, and receipts of product manufactured at refineries outside PADD 5. Refineries in the PNW produce about as much gasoline as is consumed in the region, but considerably more than enough distillate and jet to meet in-region demand. The region supplies distillate fuel and jet fuel to the global market and to other regions within PADD 5 and exports motor gasoline. The PNW also imports motor gasoline and a small amount of distillate. The combination of imports and exports is needed to manage distribution system inefficiencies and gasoline grade imbalances. The PNW typically does not receive product from other regions within PADD 5. In 2013, the region exported 26,000 b/d of motor gasoline, 26,800 b/d of jet fuel, and 43,200 b/d of distillate fuel, primarily to Canada, Mexico, and Central and South America.
Other Regions
The study also includes analysis of transportation fuels in Arizona, Hawaii, and Alaska. Additional studies are planned to analyze PADD 5 crude supply, PADD 1 (East Coast) and PADD 3 (Gulf Coast) transportation fuels markets, and PADD 2 (Midwest) and PADD 4 (Rocky Mountains) transportation fuels markets.
U.S. average retail gasoline and diesel fuel prices decrease
The U.S. average retail price of regular gasoline decreased one cent from the previous week to $2.32 per gallon on September 28, 2015, $1.03 per gallon lower than at the same time last year. Only the Midwest price increased, rising five cents to $2.33 per gallon. The West Coast price fell eight cents to $2.84 per gallon, followed by the Rocky Mountain price, which was down seven cents to $2.54 per gallon. The East Coast price decreased two cents to $2.19 per gallon, and the Gulf Coast price was down one cent to $2.02 per gallon.
The U.S. average price of diesel fuel decreased two cents from the prior week to $2.48 per gallon, down $1.28 per gallon from the same time last year. The Rocky Mountain price decreased four cents to $2.49 per gallon. The West Coast and Gulf Coast prices both fell two cents, to $2.69 per gallon and $2.32 per gallon, respectively. The East Coast and Midwest prices both decreased one cent, to $2.53 per gallon and $2.43 per gallon, respectively.
Propane inventories gain
U.S. propane stocks increased by 1.7 million barrels last week to 98.7 million barrels as of September 25, 2015, 19.2 million barrels (24.1%) higher than a year ago. Gulf Coast inventories increased by 0.8 million barrels and Midwest inventories increased by 0.6 million barrels. East Coast inventories increased by 0.2 million barrels and Rocky Mountain/West Coast inventories increased by 0.1 million barrels. Propylene non-fuel-use inventories represented 4.7% of total propane inventories.

