

China Energy Profile: Energy Demand Expected To Increase – Analysis
By EIA
China is the world’s most populous country (1.4 billion people in 2019) with a fast-growing economy that has led it to be the largest energy consumer and producer in the world.1 Rapidly increasing energy demand has made China influential in world energy markets. Despite structural changes to China’s economy during the past few years, China’s energy demand is expected to increase, and government policies support cleaner fuel use and energy efficiency measures.
China’s official data reported that its economy grew by 6.1% in 2019, which was the lowest annual growth rate since 1990. After registering an average growth rate of 10% per year between 2000 and 2011, China’s gross domestic product (GDP) growth has slowed or remained flat each year since then.2 The 2019 novel coronavirus disease (COVID-19) pandemic and resulting economic effects has adversely affected industrial and economic activity and energy use within China and are likely to push GDP growth much lower than 6% in 2020, according to numerous analysts.3
China is transitioning away from an economy that relies on growth in the manufacturing and export sectors to one that is more service oriented. In 2018, the government attempted to enact financial regulatory reforms, reduce high local government debt levels, and cut air pollution levels from the industrial sector. However, the subsequent economic slowdown has put unemployment levels at risk of rising. The trade conflict with the United States, which began in 2017 and led to an increase in tariffs on most of China’s goods exported to the United States, poses a downside risk to China’s economic growth in the next few years.
In the energy sector, the central government is moving toward more:
- Market-based pricing schemes
- Energy efficiency and anti-pollution measures
- Competition among energy firms and greater market access for smaller, independent firms
Higher investments in more technically challenging upstream hydrocarbon areas such as shale gas and renewable energy projects
China has been seeking ways to attract more private investment in the energy sector by streamlining the project approval processes, implementing policies to improve energy transmission infrastructure to link supply and demand centers, and relaxing some price controls.
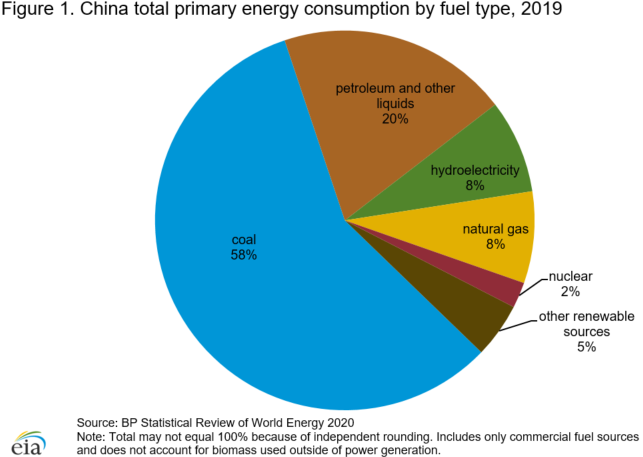
Coal supplied most (about 58%) of China’s total energy consumption in 2019, down from 59% in 2018. The second-largest fuel source was petroleum and other liquids, accounting for 20% of the country’s total energy consumption in 2019. Although China has diversified its energy supplies and cleaner burning fuels have replaced some coal and oil use in recent years, hydroelectric sources (8%), natural gas (8%), nuclear power (2%), and other renewables (nearly 5%) accounted for relatively small but growing shares of China’s energy consumption.4 The Chinese government intends to cap coal use to less than 58% of total primary energy consumption by 2020 in an effort to curtail heavy air pollution that has affected certain areas of the country in recent years. According to China’s estimates, coal accounted for a little less than 58% in 2019, which places the government within its goal.5 Natural gas, nuclear power, and renewable energy consumption have increased during the past few years to offset the drop in coal use.6 (Figure 1)
Petroleum and other liquids
Exploration and production
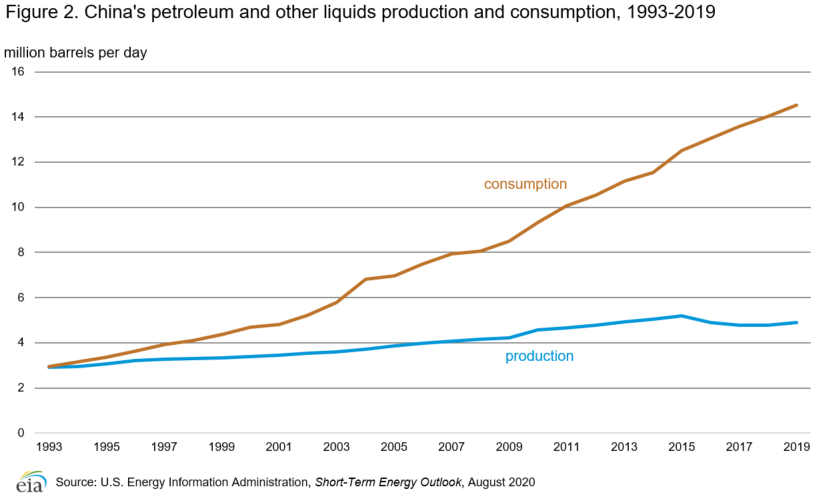
Although China was the fifth-largest petroleum and other liquids producer in the world in 2019, most of the country’s production comes from legacy fields that require expensive enhanced oil recovery techniques to sustain production. After declining considerably for three years, China’s petroleum and other liquids production reversed course and increased to 4.9 million barrels per day (b/d) in 2019 (Figure 2). Nearly 80% of the total liquids production was from crude oil, and the remainder was from conversions of coal and methanol to liquids, biofuels, and refinery processing gains.
Oil production from coal-to-liquids (CTL) plants was an estimated 108,000 b/d and from methanol-to-liquids was around 500,000 b/d in 2019.7 China is attempting to monetize its vast coal reserves by converting some of it to cleaner-burning fuels and using them for bolstering energy security in the petroleum sector. At the end of 2016, Shenhua Group brought online the world’s largest CTL plant, Ningxia, with a capacity to produce more than 80,000 b/d of oil.8 China’s CTL plant capacity could triple in size between 2017 and 2023, barring project delays.9 Most of China’s methanol is sourced from coal, and the government is encouraging more conversion of methanol to fuel and petrochemicals.
In response to China’s growing use of imported crude oil, the government called for the national oil companies (NOCs) to raise domestic oil production levels in 2018. The oil price recovery starting in 2016 also made developing China’s technically challenging fields profitable. These factors prompted the three major NOCs to increase joint upstream investment by 30% in 2018 and 23% in 2019.10
However, China’s NOCs have indicated that they will reduce overall capital expenditures in 2020, but they have not provided details of their oil and natural gas production targets.11 International oil prices were halved in March 2020, driven by severe contraction in fuel demand in response to efforts to prevent the spread of the COVID-19 pandemic and a significant increase in crude oil supply after production cuts were suspended by members of the Organization of the Petroleum Exporting Countries (OPEC) and partner countries. Depressed oil prices pose a significant downside risk to the NOCs upstream investments and the country’s oil production levels in the next few years. Domestic crude oil production from many mature fields and technically challenging new developments, especially those involving onshore tight oil plays, is cost prohibitive at low oil prices and will likely decline during the next two years.12
To attract more investment and technical expertise and make China’s upstream sector more competitive, the government plans to ease restrictions on foreign and private investment in China’s conventional oil and natural gas upstream sectors starting in May 2020. Previously, foreign firms could not own a majority stake in a project and were required to be part of a joint venture with one of the NOCs to develop China’s oil and natural gas fields. Foreign firms and domestic independent companies that hold net assets of $43 million can participate in exploration and development of Chinese reserves.13 This initiative could boost crude oil production in more technically challenging fields in the longer term, although declines in mature basins will likely continue offsetting new production.
Consumption
China’s oil consumption growth accounted for an estimated two-thirds of incremental global oil consumption in 2019. China consumed an estimated 14.5 million b/d of petroleum and other liquids in 2019, up 500,000 b/d, or nearly 4%, from 201814 (Figure 2).
The warmer-than-normal 2019–20 winter in the northern hemisphere and ongoing efforts to prevent the spread of COVID-19 is expected to drastically lower China’s growth in petroleum products, primarily jet fuel, gasoline, and diesel, with the most acute demand destruction occurring during the first quarter of 2020.
Diesel and gasoline accounted for the largest shares (27% and 24%, respectively, in 2018) of consumed oil products during the past several years. However, the pace of oil demand growth in the transportation sector has declined in the past few years because of China’s economic slowdown, stricter environmental measures resulting in higher fuel efficiency standards and restrictions on urban vehicle use, and a higher penetration of alternative fuel vehicles (electric vehicles, compressed natural gas vehicles, and trucks and trains running on liquefied natural gas). Alternative fuel vehicles have grown exponentially in China and have displaced a growing amount of gasoline and diesel each year.15 However, the sale of vehicles that run on alternative fuels fell slightly in 2019 from 2018 following China’s subsidy cut for these vehicles in July 2019.16 China, which has some of the most stringent global fuel standards, implemented national fuel standards equivalent to Euro VI to lower sulfur standards in gasoline and diesel starting in 2020 17
China’s swiftly developing petrochemical sector is bolstering demand for liquefied petroleum gas (LPG) and naphtha. Several propane dehydrogenation (PDH) plants are slated to come online through 2022 and will increase LPG demand. Several steam cracker projects are also under construction and require a combination of naphtha, LPG, and ethane for their fuel supply.18
Refining
China has steadily expanded its oil refining capacity during the past decade to meet its strong demand growth and to process a wider range of crude oil types. China’s installed crude oil refining capacity reached about 17 million b/d by the end of 2019 and ranks second behind the United States’ capacity globally.19
The new capacity that began coming online in 2019 is from the first large integrated refinery complexes that are linked to petrochemical facilities. These refineries are primarily intended to produce naphtha for the petrochemical plants. The 400,000 b/d Hengli refinery began operations in mid-2019, and Zhejiang’s Rongsheng facility, with 400,000 b/d of capacity, brought online all of the first phase units by the end of 2019.20 Sinopec and Kuwait Petroleum are constructing a 200,000 b/d integrated refinery in Zhanjiang, coming online by 2021. A second phase of Zhejiang’s Rongsheng plant and the 320,000 b/d Shenghong Petrochemical refinery are slated to be online by the mid-2020s, and several other large refineries are in various stages of planning.21
Petroleum and other liquids storage
Even though China releases limited information on its crude oil inventories and stockbuilding progress, industry analysts assess that Beijing has been swiftly filling its strategic petroleum reserves (SPR) since 2016. Industry trade press estimates that China has more than 300 million barrels of crude oil stored in at least 12 SPR facilities. In addition, China has a sizeable amount of commercial storage capacity that houses some of the country’s strategic reserves, which industry analysts estimated up to 600 million barrels in 2019.22
In September 2019, China announced that the country had 80 days of crude oil inventories to cover its imports, which is close to China’s goal for its SPR program of 90 days of import cover.23 Despite closing the gap on its target inventories, China has plans to begin building the third phase of its SPR program in the next few years.24 Industry analysts suggest that China continued to build its oil storage reserves through the first half of 2020 to take advantage of the low international oil prices. Crude oil imports remained higher than the levels from the previous year while oil demand declined significantly.25
Trade
As China’s oil demand continues to outstrip domestic production and the country continues building its strategic petroleum reserves, oil imports have greatly increased during the past decade, reaching record highs in 2019. To ensure adequate oil supply and mitigate geopolitical uncertainties, China has diversified its sources of crude oil imports in recent years. China, which became the world’s largest crude oil buyer in 2017, imported 10.1 million b/d of crude oil on average in 2019, rising almost 10% from 9.2 million b/d in 2018.26
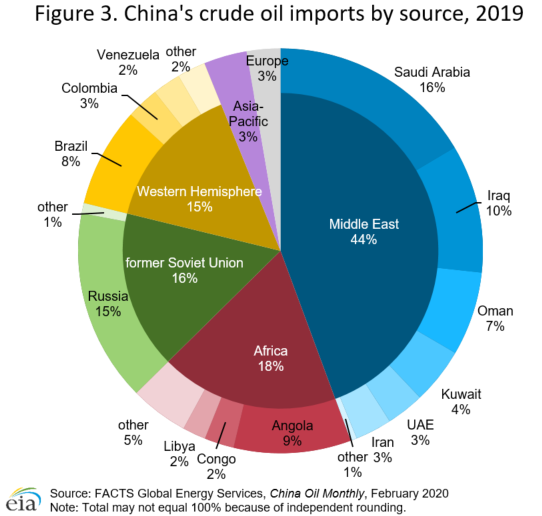
Saudi Arabia, which historically has exported a significant portion of China’s crude oil, was the largest source of imports in 2019, with a 16% share.27 Saudi Aramco signed more long-term crude oil supply agreements with Chinese companies in early 2019 as the company focused on supplying China’s new refineries and petrochemical plants.28
After being China’s top source of crude oil imports for three years, Russia returned to being China’s second-largest source of crude oil imports in 2019 (Figure 3). Crude oil exports from Russia to China began to increase following new upstream production from Eastern Siberian fields, construction of pipeline and transmission infrastructure between the countries, and China’s lifting of a crude oil import ban on its independent oil refineries in the country’s northeastern region in 2015.
China imported greater shares from the United Kingdom, Brazil, and Libya since 2017 as a result of higher production from these countries.
Sanctions on Iran’s crude oil and condensate exports by the United States have significantly reduced China’s intake of oil from Iran, particularly in the latter half of 2018 and in 2019. Oil from Iran fell to 3% of China’s imports in 2019 compared with 8% in 2016, according to China’s official import data.29 China reported that oil imports from Iran fell to about 100,000 b/d at the end of 2019, although it may have additional volumes imported as bonded storage that have not yet cleared customs. Saudi Arabia offset most of this loss.30
China’s purchases of crude oil from Venezuela has dropped since 2017 because of U.S. sanctions on Venezuela and the country’s economic crisis that has severely hindered its oil production.31
Crude oil imports from the United States declined significantly from the 2018 level of 231,000 b/d.32 China imposed a 5% tariff on U.S. crude oil imports in September 2019, which reduced oil imports from the United States by 48% in 2019. After signing the first phase of a trade deal with the United States in January 2020, China reduced the tariff on U.S. crude oil imports to 2.5% starting in February 2020. China’s government also began to offer tariff exemptions on crude oil from the United States so that China can meet its agreement to purchase $52 billion of additional U.S. energy products through 2021.33
Natural Gas
Exploration and production
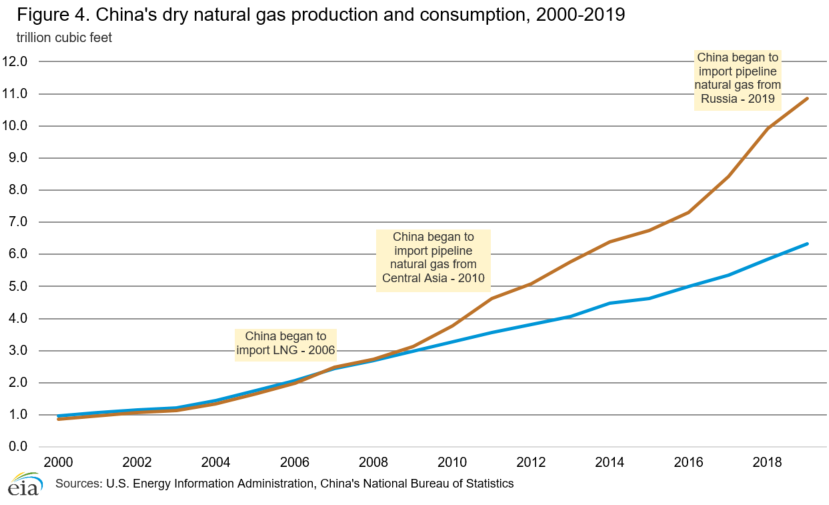
China’s natural gas production has been steadily rising during the past several years as the country tries to fill the growing need for natural gas. China’s NOCs produced an estimated 6.3 trillion cubic feet (Tcf) of natural gas in 2019, 8% higher than in 2018 (Figure 4).34 Although still in its early phase of development, China’s shale gas production rose substantially by 14% from 2017 levels to about 365 billion cubic feet (Bcf) in 2018.35
China’s 13th Five Year Plan targets natural gas production to reach 6 Tcf for conventional gas, 1.1 Tcf for shale gas, and less than 0.6 Tcf for coalbed methane by 2020. To promote domestic upstream development of unconventional natural gas, China introduced financial incentives for producers. The government reduced the resource tax on shale gas production from 6% to 4.2% starting in April 2018 through March 2021. In addition, China extended subsidies on all unconventional production through 2023 and, for the first time, included tight gas (low-permeability natural gas found in reservoir rocks) as an unconventional natural gas source eligible to receive subsidies. China’s NOCs accelerated their investments in upstream natural gas developments to respond to the government’s call in 2018 to ease future natural gas shortages and to make China more self-sufficient in natural gas resources.36
China’s offshore natural gas production increased 10.5% from 2018 to 335 Bcf in 2019, mostly from growth in the South China Sea.37 CNOOC, China’s major offshore producer, plans to commission the country’s second deepwater natural gas field, Lingshui 17-2, and the newly explored large Bozhong 19-4 natural gas and condensate field in the Bohai Bay in northeastern China by 2022.38
Consumption
China’s government anticipates boosting the share of natural gas as part of total energy consumption from almost 8% in 2019 to 10% by 2020 and 14% by 2030 to alleviate the elevated levels of pollution resulting from the country’s heavy coal use.39 Although natural gas is still a small contributor to China’s overall energy portfolio, it is swiftly becoming an important fuel source, and China is now one of the fastest-growing natural gas markets in the world.
China’s natural gas consumption rose by 9% in 2019 to 10.8 Tcf from 9.9 Tcf in 2018.40 During the past decade, China’s natural gas demand increased rapidly by about 13% per year, making it the world’s third-largest natural gas consumer behind the United States and Russia (Figure 4).41 Although most natural gas consumption comes from industrial users, including mining and oil and natural gas extraction (accounting for more than 40% in 2018), the shares of natural gas consumption in the electric power and transportation sectors have risen during the past decade.42
Several factors have contributed to robust growth in natural gas consumption during the past few years. Poor air quality, particularly in urban areas of northeastern China, where excessive coal use in the winter causes smog and dangerous levels of pollution, prompted the government to enforce fuel switching from coal to natural gas for industrial use, power generation, and residential and commercial heating. Strict environmental targets set by the central government in 2017 created a surge in natural gas demand by northern cities during peak demand use in the winter months in 2017 and 2018.43 Other demand drivers were low natural gas prices, higher natural gas use in the transportation sector, and the expansion of natural gas infrastructure to relieve supply bottlenecks and to transport natural gas to demand centers.
China relaxed its coal-to-gas switching program at the end of 2018 to alleviate natural gas shortages that occurred in the winter of 2017–18, particularly in northern cities. This policy shift and slower economic growth caused the pace of China’s natural gas demand growth in 2019 to decelerate from significantly higher growth in 2017 and 2018.44
Natural gas is generally more expensive than coal and continues to face supply constraints because of insufficient storage, import terminals, and pipeline capacity. The rate of demand growth in the next few years is expected to depend on China’s environmental policies in the power sector and increased coal-to-gas switching for households and industries. The rate of demand growth also likely depends on the pace at which China can build its natural gas infrastructure. The response to the COVID-19 pandemic is expected to adversely affect China’s natural gas demand growth, especially for the industrial, commercial, and transportation sectors, in the first part of 2020.45
Liquefied natural gas
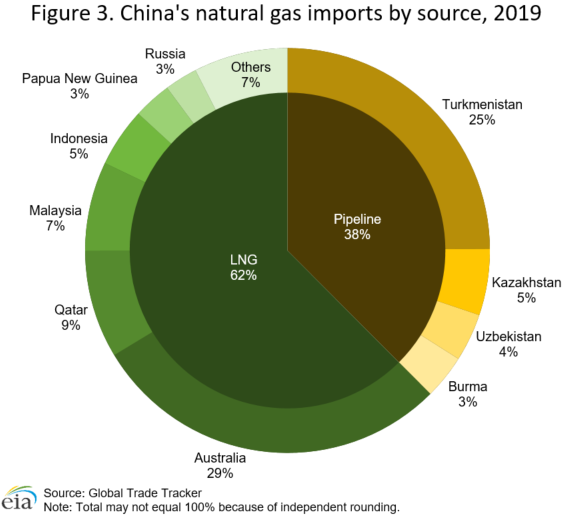
To fill the widening gap between China’s domestic natural gas production and demand, the industry has relied on an increasing amount of pipeline imports and liquefied natural gas (LNG) trade. In 2019, China, the largest natural gas importer in the world, imported 4.6 Tcf, 7% higher than 2018 levels. LNG imports account for 62% of the total, and pipeline imports, mostly from Turkmenistan, account for 38% (Figure 5).46
China surpassed South Korea and became the second-largest LNG importer after Japan in 2017. LNG imports climbed to 2.9 Tcf in 2019, rising 13% from 2018 levels. LNG imports have sharply accelerated each year since 2015 as a result of lower global LNG prices and China’s coal-to-gas switching policies.47 As a result of the economic and energy consumption slowdown in the first few months of 2020 in response to COVID-19 containment efforts, some Chinese NOCs have declared force majeure on some contract cargoes or have delayed receipts because natural gas demand has contracted. The macroeconomic effects from the pandemic response will likely dampen China’s LNG growth in 2020.48
China has diversified its LNG suppliers during the past few years, and Australia is now the largest supplier, at 46% in 2019. Purchases from new natural gas liquefaction projects in Australia began in 2016. LNG imports from the United States grew rapidly in 2017 and 2018, reaching an average of 5% of China’s total LNG imports. However, U.S. imports slowed significantly after September 2018 when China imposed a 10% tariff on U.S. LNG shipments as part of the trade dispute between the two countries. China raised LNG tariffs on the United States to 25% in June 2019, and LNG imports from the United States dropped to zero by April 2019.49 After signing the first phase of a trade deal with the United States in January 2020, China’s government offered tariff exemptions on LNG from the United States, which could bolster U.S. LNG cargoes to China for the first time in more than a year.50
As of late 2019, China had 21 LNG regasification terminals with a combined capacity of 3.5 Tcf. China is quickly building various terminals along its entire coastline, and another 1.9 Tcf is under construction and slated to come online by 2023.51
China’s rapidly growing natural gas demand during the past few years has opened up opportunities for independent or non-NOC Chinese energy companies to operate in the LNG space. Several local state-owned municipalities, natural gas distributors, and power developers own stakes in existing LNG terminals. In 2019, the government renewed an initiative in 2014 to allow access rights to third-party companies for supplying natural gas to LNG terminals, providing more supply opportunities for firms involved along the entire LNG supply chain, from the upstream natural gas procurement to the downstream distribution. CNOOC has signed several LNG third-party access deals with various independent companies since late 2018, and it released third-party access bids on the Shanghai Petroleum and Gas Exchange in early 2019.52
Pipeline imports and infrastructure
Natural gas pipeline imports fell slightly in 2019 to 1.7 Tcf, most of which are from Turkmenistan.53 In addition to the natural gas pipeline imports from Central Asia and Burma, China began importing natural gas from Russia through the Power of Siberia pipeline in December 2019. China and Russia signed a natural gas deal in 2014 in which China will import an average of 1.3 Tcf per year of natural gas from Gazprom’s East Siberian fields during a 30-year period. Russia expects to ramp up supplies during the next few years and send 530 million cubic feet by 2022. Russia’s portion of the pipeline project to the Chinese border came online at the end of 2019. China plans to expand its side of the pipeline, which will deliver natural gas to Beijing and other demand centers, in late 2020.54 This new supply of natural gas from Russia will compete with the LNG imports into northern China and diversify China’s natural gas supply.
LNG will also encounter more competition from Line D, the fourth pipeline of the Central Asia-China Pipeline system, in the next several years. This pipeline is slated to add another 1.1 Tcf of capacity and increase the amount of natural gas from Turkmenistan to 2.3 trillion cubic feet per year (Tcf/y). Line D is scheduled to come online as early as 2022, but it has encountered several delays in the past few years.55
China extended another contract with Kazakhstan and doubled the amount of imported natural gas to 350 Bcf/y until 2023.56
China’s domestic pipeline infrastructure is undergoing significant development, and the government’s goals are to increase the country’s natural gas pipeline coverage and to improve market competition along the value chain of natural gas sales. The government created a national oil and natural gas pipeline company, PipeChina, in December 2019. In the next few years, China is set to separate the NOCs’ upstream, midstream, and downstream pipeline sectors and allow open access to companies on the national pipeline. In addition, in 2019, China began to allow foreign companies to invest in city natural gas distribution pipelines to facilitate greater investment levels and faster infrastructure development.57
Coal
Consumption
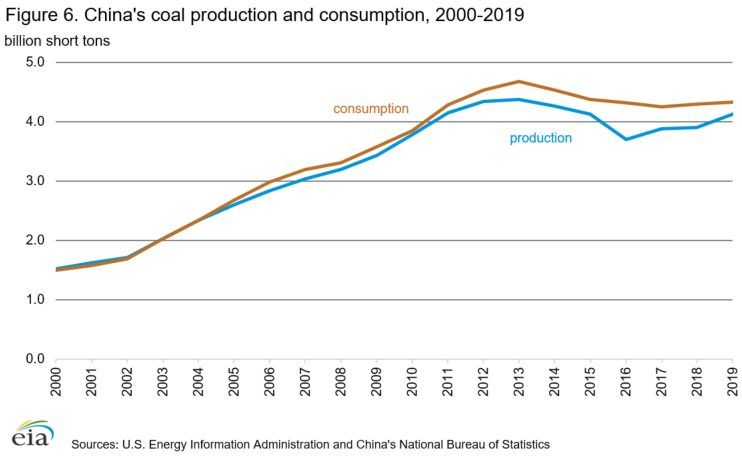
After several years of declines, China’s coal consumption grew by 1% each year in 2018 and 2019, based on physical volume (more than 4.3 billion short tons in 2019), according to estimates of China’s National Bureau of Statistics (NBS) (Figure 6).58 Electricity and industrial demand growth, especially from steel production, were strong.59 In addition, some provincial governments eased air quality measures starting in the winter of 2018–19 as a result of natural gas supply shortages and high natural gas prices during peak energy demand periods in 2017.60
The power sector accounted for nearly 60% of China’s coal consumption in 2018, and the remainder of China’s coal use is from industry, such as steel and cement production, and residential heating.61
China’s coal demand in the next few years is likely to be determined by the magnitude of the COVID-19 pandemic in China and its impact on the electricity and industrial demand growth and the government’s continued policy on air quality issues and fuel switching. Coal will eventually be phased out of the residential sector for heating purposes as the government targets more households each year to convert from coal boilers to natural gas or electric boilers. Competition with cleaner-burning fuels, China’s shift to a less energy-intensive economy, and the trade conflict with the United States will pose downside risks to coal demand in the next several years. However, coal will likely remain a pillar of the electric power and heating demand because of the country’s abundant resources and the government’s intention to increase use of clean coal technology
Exploration and production
Coal production, which declined for three consecutive years through 2016, has risen each year since then and reached an estimated 4.1 billion short tons in 2019 (Figure 6).62 China’s government adopted a supply-side approach to control the volatility of domestic coal prices through a targeted price range, which allowed domestic producers to be profitable and compete with coal imports.
Because coal demand from the power sector and coal prices began rising at the end of 2016, China relaxed several policies that restricted domestic coal production. China raised production capacity and began to replace uncompetitive and outdated mine capacity. Output growth was from the largest coal-producing mines in the north central and northwestern areas of the country. China continues to replace outdated coal capacity with new, more efficient mine capacity and to close smaller mines in the eastern and southern regions.63 Furthermore, China’s recent expansion of long-range railway capacity, such as the Haoji Railway commissioned in October 2019, to connect the coal-producing centers in the interior to eastern demand centers is instrumental to bolstering domestic production and responding to coal demand.64
Trade
China’s coal imports, the largest in the world, rose from 2015 levels of 225 million short tons (MMst) to about 330 MMst in 2019.65 After China cut domestic coal production capacity in 2016, markets along the southeastern coasts tightened and domestic prices rose substantially, leading to a recovery in coal imports. However, after 2016, imports increased at a slower pace. China has controlled coal import levels during the past few years to aid domestic producers by leveraging import quotas or setting restrictions at various ports. Therefore, imports are determined by both market fundamentals and policy initiatives.66
Indonesia remains China’s largest source of imported coal with a 46% share. Indonesia offers a low quality coal that blends well with China’s domestic coal.67 Australia ranks as the second-largest coal exporter to China with a 26% share and is a major supplier of metallurgical coal primarily used for steel production. Neighboring countries Mongolia and Russia have significantly increased their shares of coal exports to China during the last few years, accounting for 12% and 11% of imports, respectively, in 2019.68
Electricity
China plans to rely on more electric generation from nuclear, renewable sources, and natural gas to replace some coal-fired generation to reduce carbon dioxide emissions and the heavy air pollution in urban areas.
Generation
China generated about 6,712 terawatthours (TWh) of net electricity in 2018, an increase of more than 7% from 2017.69 Higher generation growth was strengthened by a return to growth in the industrial sector and strong growth in the service and residential sectors. Higher use of technology in manufacturing and other sectors is a significant driver of electricity demand. In addition, infrastructure expansion bolstered electricity demand in the steel and cement sectors. More transitions from coal to electricity for residential and commercial heating purposes is contributing to a smaller portion of the power demand growth.70 Estimates by the Chinese government report that power generation rose by about 5% in 2019. The economic slowdown during late 2018 and 2019 reduced electricity demand.71 Further erosion of electricity demand growth is set to occur in 2020 as a result of the effects of COVID-19 containment measures on China’s economy and industrial output.72
Fossil fuels, primarily coal, accounted for 69% of power generation sources in 2018 (Figure 7). Coal is expected to remain the dominant fuel in the power sector in the coming years, while natural gas is replacing some of the coal-fired capacity in the eastern part of the country where power demand is higher and in the northeastern region where stricter environmental regulations have reduced coal-fired power production in this area. Natural gas is gradually gaining shares of the electricity generation portfolio, but it still accounted for less than 4% in 2018.73 The government intends to replace older coal-fired units with ultra-low emission technology and allow cities to build clean coal heating systems.74
China’s government has a goal to produce at least 15% of total energy consumption by 2020 from non-fossil fuel sources (up from 12.7% in 2018) as it aims to address environmental issues and replace some coal-fired generation.75 To this end, China is encouraging investment in renewable energy and accompanying transmission infrastructure through financial and economic incentives. Altogether, hydropower and other renewable projects generated more than 1,800 TWh of net electricity in 2018, an 11% increase from 2017 levels.76
In 2018, China was the world’s largest wind generator at about 366 TWh, 20% higher than the level in 2017.77 The government has encouraged investment in grid development and measures to improve flexibility in the transmission system, especially during peak hours. Several ultrahigh voltage (UHV) transmission lines that carry electricity over long distances began operations since 2014, and more are scheduled to come online by 2020. However, some of these UHV projects are reportedly delayed or underutilized.78
Solar power is the fastest-growing electric generation source. Net generation in 2018 was 178 TWh, 51% higher than in 2017.79 Inadequate transmission capacity has curtailed some solar generation from reaching the grid. As with wind projects, the government is setting policies to limit new solar projects in regions that have low utilization and high curtailment rates. China has been reducing the subsidies for solar power investments since 2016, especially in utility-scale projects, to alleviate some of the current overcapacity.80
Although nuclear generation is a small portion of the country’s total power generation portfolio, China is actively promoting nuclear power as a clean, efficient, and reliable source of electricity generation. China generated about 272 TWh of net nuclear power in 2018, accounting for 4% of total net generation.81 However, the country rapidly expanded its nuclear capacity after 2015, which will likely boost nuclear-fired power production in the next several years. As of August 2020, China’s net installed nuclear capacity was nearly 46 gigawatts (GW), more than half of which was added since the beginning of 2015. Companies in China are constructing an additional 11 GW of capacity, about 18% of the global nuclear power capacity currently being built. These plants are slated to become operational by 2025, and several more facilities are in various stages of planning.82
Capacity
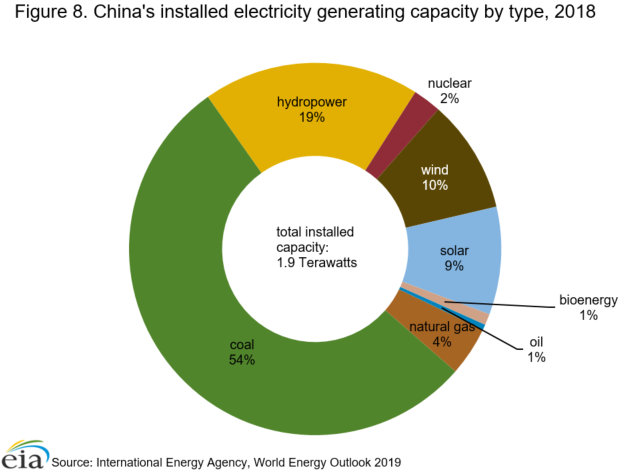
China’s installed electricity generating capacity was an estimated 1.9 terawatts (TW) at the end of 2018. As China’s generating capacity expanded during the past several years in response to the country’s economic development, capacity grew to be the highest in the world. However, a slowdown in capacity builds is expected during the next few years to reduce the capacity overhang.
Fossil fuel-fired power capacity has historically accounted for the bulk of installed capacity, and coal continued to account for most of China’s electric capacity in 2018 (Figure 8).83 Power plants fueled by natural gas, nuclear, wind, and solar are gradually replacing coal’s capacity share. The government plans to limit coal capacity to 1,100 GW by 2020.84
Notes
- In response to stakeholder feedback, the U.S. Energy Information Administration (EIA) has revised the format of the Country Analysis Briefs. As of September 2019, updated briefs are available in two complementary formats: the Country Analysis Executive Summary provides an overview of recent developments in a country’s energy sector, and the Background Reference provides historical context. The Background Reference for China is forthcoming. Archived versions will remain available in the original format.
- Data presented in the text are the most recent available as of August 2020.
- Data are EIA estimates unless otherwise noted.
Endnotes
- U.S. Energy Information Administration, International Energy Statistics.
- World Bank Data, GDP growth (annual %), China (accessed September 2019); Reuters, “China posts weakest growth in 29 years as trade war bites, but ends 2019 on better note,” January 16, 2020.
- South China Morning Post, “China may adjust 2020 GDP growth target due to coronavirus, government policy adviser says,” February 18, 2020; CNBC, “Analysts are cutting their China GDP forecasts amid coronavirus outbreak,” February 5, 2020; Reuters, UPDATE 1-Analysts slash China growth forecasts to record lows amid coronavirus“,” March 18, 2020; Reuters, “Exclusive: China to ramp up spending to revive economy, could cut growth target – sources,” March 19, 2020; Reuters, “China’s 2020 GDP growth set to sink to 44-year low as coronavirus cripples economy: Reuters poll,” April 14, 2020.
- BP Statistical Review of World Energy 2020.
- China Daily, “China to cap coal consumption at 4.1 billion tons by 2020,” January 18, 2017; Reuters, “Coal’s share of China energy mix falls to 57.7% in 2019 – stats bureau,” February 27, 2020; China’s National Bureau of Statistics, “Statistical Communiqué of the People’s Republic of China on the 2019 National Economic and Social Development,” February 28, 2020; BP Statistical Review of World Energy 2020.
- China’s National Bureau of Statistics, “Statistical Communiqué of the People’s Republic of China on the 2019 National Economic and Social Development,” February 28, 2020.
- U.S. Energy Information Administration, Short-term Energy Outlook, August 2020.
- China Daily, “Significant coal-to-liquid project in production in Ningxia,” December 28, 2016.
- International Energy Agency, Coal 2018, pages 79-80; International Energy Agency, Coal 2019, 18 and 86.
- International Energy Agency, Oil Market Report, April 15, 2020, page 24 and Oil Market Report, April 11, 2019, page 24; Reuters; International Energy Agency, Oil 2020: Analysis and Forecast to 2025, page 66; Reuters, “Drill, China, drill: State majors step on the gas after Xi calls for energy security,” February 1, 2019.
- S&P Global Platts, “PetroChina to set 2020 capex, output in line with oil price movements,” March 26, 2020; Reuters, “China’s CNOOC group to trim 2020 investment by up to 15%,” April 7, 2020; Reuters, “China’s Sinopec cuts 2020 capital spending by 2.5%,” March 29, 2020; Newsbase AsianOil, “Sinopec trims 2020 capex, expands upstream budget,” April 2, 2020, page 8; Newsbase AsianOil, “China capitalises on Saudi-Russian price war,” page 7.
- Newsbase AsianOil, “Chinese crude production could prove too costly,” March 19, 2020, pages 8-9.
- S&P Global Platts, “Analysis: China eases foreign ownership rules in oil and gas upstream, city gas distribution,” July 3, 2019; Reuters, “China opens up oil and gas exploration, production for foreign, domestic firms,” January 8, 2020.
- U.S. Energy Information Administration, Short-term Energy Outlook, August 2020.
- FACTS Global Energy, Asia Pacific Petroleum Databook 1: Supply and Demand, Spring 2019, pages 27-29; International Energy Agency, Oil 2020, pages 29-30 and 34; International Energy Agency, Oil 2019, pages 35-38.
- Reuters, “China says no significant cut in new energy vehicle subsidies in 2020,” January 11, 2020.
- International Energy Agency, Oil 2020, page 29; The International Council on Clean Transportation, “China’s Stage VI emissions standard for heavy-duty vehicles (final rule),” July 20, 2018; Xinhua News, “China Focus: China starts implementing tougher vehicle emission standards,” July 2, 2019; Dieselnet, China: Cars and Light Trucks; International Energy Agency, Oil Market Report, November 15, 2019, page 12.
- FACTS Global Energy, Asia Pacific Petroleum Databook 1: Supply and Demand, Spring 2019, page 27; U.S. Energy Information Administration.
- International Energy Agency, Oil 2020, page 89.
- Reuters, “UPDATE 1-China’s Zhejiang Petrochemical completes phase 1 startup at refinery-petchem complex,” December 19, 2019; Xinhua Net, “Oil refinery of China’s Hengli Petchem enters full operation,” May 17, 2019; Reuters, “China’s Hengli Petrochemical run new oil refinery at full output in May,” May 6, 2019.
- FACTS Global Energy, Asia-Pacific Databook 2: Refining Configuration and Construction, Fall 2019, pages 21-25; International Energy Agency, Oil 2020, pages 95, 113.
- The Oxford Institute for Energy Studies, “US-China: The Great Decoupling,” July 2019, page 8; Newsbase AsianOil, “China’s Imports Continue to Rise,” April 16, 2020, page 9; S&P Global Platts, “Analysis: China puts Iranian crude into strategic petroleum reserves in June,” July 30, 2019; FACTS Global Energy, China Oil Monthly, January 21, 2020, page 3; FACTS Global Energy, Energy Insights, “China’s Crude Storage: Is Enough Ever Really Enough?,” January 22, 2019; China’s National Bureau of Statistics, “Significant progress has been made in the construction of national oil reserves,” December 29, 2017; Reuters, “UPDATE 2-China accelerates stockpiling of state oil reserves over 2016/17,” December 29, 2017; Reuters, “China’s crude oil buying spree looks set to continue – IEA,” October 12, 2017.
- Reuters, “Column: Bearish signal for crude as China closes in on filling oil storage,” September 23, 2019; Reuters, “China has enough oil inventories to last about 80 days: NEA,” September 20, 2019.
- S&P Global Platts, “Analysis: China puts Iranian crude into strategic petroleum reserves in June,” July 30, 2019.
- Reuters, “Coronavirus? What coronavirus? China’s commodity imports remain robust: Russell,” April 14, 2020.
- FACTS Global Energy, China Oil Monthly Data Tables, February 2020, page 2.
- FACTS Global Energy, China Oil Monthly Data Tables, February 2020, page 2.
- Reuters, “Saudi Arabia to boost oil exports to China with strategy shift,” February 26, 2019; Middle East Economic Survey, “China Takes Record Saudi Crude As Iran Volumes Fall to 9-Year Low,” August 2, 2019, pages 8-9.
- FACTS Global Energy, China Oil Monthly Data Tables, February 2020, page 2.
- FACTS Global Energy, China Oil Monthly Data Tables, February 2020, page 2; Middle East Economic Survey, “China Takes Record Saudi Crude As Iran Volumes Fall to 9-Year Low,” August 2, 2019, pages 8-9.
- Reuters, “China’s July Venezuela oil imports fall over U.S. sanctions,” August 25, 2019.
- U.S. Energy Information Administration, International Energy Statistics (accessed August 2020).
- Reuters, “Factbox: China’s tariffs on U.S. commodities and energy,” August 26, 2019; S&P Global Platts, “China to cut tariff on imports of US crude to 2.5% from 5%: State Council,” February 6, 2020; Reuters, “China to grant tariff exemptions on 696 U.S. goods to support purchases,” February 17, 2020; Reuters, “Chinese private refiner buys U.S. crude after Beijing allows tariff waivers: sources,” March 5, 2020; Reuters, “Chinese buyers snap up U.S. oil purchases at widest discounts ever,” April 1, 2020.
- U.S. Energy Information Administration estimates based on China’s National Bureau of Statistics.
- FACTS Global Energy, East of Suez Gas Databook 2019, China Natural Gas Outlook, September 2019, page 21; FACTS Global Energy, China Gas Monthly, March 2019, page 4.
- International Energy Agency, Gas Market Report 2019, pages 79-83; Oil and Gas Journal, “WoodMac notes tight gas featured in China’s new unconventional gas subsidy,” July 1, 2019; Reuters, “China aims to rev up shale gas drive, wean itself off imports amid U.S. trade row,” September 2, 2019.
- CNOOC Limited, 2019 Annual Results, March 25, 2020, page 18.
- Reuters, “China CNOOC to start pumping at large deepsea gas field at end-2021: official,” September 24, 2019; CNOOC Limited, 2019 Mid-Year Review Analyst Briefing, August 29, 2019, pages 9 and 27.
- International Energy Agency, Gas Market Report 2019, page 20; The Oxford Institute for Energy Studies, “The Outlook for Natural Gas and LNG in China in the War Against Air Pollution,” December 2018, page 33; FACTS Global Energy, East of Suez Gas Databook: China Natural Gas Outlook, September 2019, page 17.
- U.S. Energy Information Administration estimates based on China’s National Development and Reform Commission.
- U.S. Energy Information Administration estimates; BP Statistical Review of World Energy 2019.
- FACTS Global Energy, East of Suez Gas Databook: China Natural Gas Outlook, September 2019, page 28.
- The Oxford Institute for Energy Studies, “The Outlook for Natural Gas and LNG in China in the War against Air Pollution,” December 2018, pages 11-20.
- S&P Global Platts, “Analysis: China’s rationalized coal-to-gas policy crimps winter gas demand growth,” November 7, 2019; South China Morning Post, “China’s rush to dump coal for gas is modified to avoid repeat of winter heating crisis,” August 29, 2018; The Oxford Institute for Energy Studies, “China’s Natural Gas Development Report – Reality Check,” December 2019, page 1.
- FACTS Global Energy, China Gas Monthly, March 18, 2020, pages 3-4; S&P Global Platts, “China’s Jan-Feb natural gas import growth slows to 2.8% in 2020 from 18.5% in 2019,” March 7, 2020.
- Global Trade Tracker (accessed March 2020); BP Statistical Review of World Energy 2019; U.S. Energy Information Administration.
- Global Trade Tracker (accessed March 2020); International Energy Agency, Gas Market Report 2019, page 116.
- World Oil, “More Chinese LNG orders canceled under new force majeure claims,” March 5, 2020.
- Global Trade Tracker (accessed March 2020); Reuters, “Factbox: How China tariffs on U.S. commodities, energy stand after ‘phase one’ trade deal,” December 16, 2019.
- Reuters, “U.S. LNG cargoes heading to China after Beijing awards tax waivers,” April 7, 2020.
- FACTS Global Energy, East of Suez Gas Databook 2019, China Natural Gas Outlook, September 2019, pages 31-33.
- FACTS Global Energy, China Gas Monthly, June 18, 2019, pages 3-4; S&P Global Platts, “CNOOC kick-starts China’s first long-term LNG terminal access,” March 13, 2019.
- Global Trade Tracker (accessed February 2020).
- FACTS Global Energy, East of Suez Gas Databook 2019, China Natural Gas Outlook, September 2019, page 23; International Energy Agency, Gas Market Report 2019, page 120; Reuters, “China imports 840 mln cubic meters of Siberian natgas since pipeline launch,” February 26, 2020.
- International Energy Agency, Gas Market Report 2019, page 120; FACTS Global Energy, “Gas/LNG Alert, “Slowdown in China LNG Demand Growth over 2019-2021 Amid Tepid GDP Growth and New Pipeline Gas Start-up,” March 1, 2019; Eurasianet, “Tajikistan Resumes Building Turkmenistan-China Pipeline Tajikistan Resumes Building Turkmenistan-China Pipeline,” January 31, 2018; Radio Free Europe, “Tajik Claim Of Pipeline Progress Is Welcome News In Turkmenistan,” January 31, 2020.
- International Energy Agency, Gas Market Report 2019, page 119; FACTS Global Energy, “Gas/LNG Alert, “Slowdown in China LNG Demand Growth over 2019-2021 Amid Tepid GDP Growth and New Pipeline Gas Start-up,” March 1, 2019.
- FACTS Global Energy, East of Suez Gas Databook 2019, China Natural Gas Outlook, September 2019, page 14; FACTS Global Energy, China Gas Monthly, December 2019, page 3; Reuters, “China sets up state oil, gas pipe firm to boost competition: Xinhua,” December 8, 2019; China Daily, “Foreign investment welcomed in gas and heating network,” July 9, 2019.
- U.S. Energy Information Administration estimates using growth rates of National Bureau of Statistics of China, “Statistical Communiqué of the People’s Republic of China on the 2018 National Economic and Social Development,” February 28, 2019; National Bureau of Statistics of China, “Statistical Communiqué of the People’s Republic of China on the 2019 National Economic and Social Development,” February 28, 2020.
- International Energy Agency, Coal 2019, pages 16-18 and 87.
- South China Morning Post, “China’s rush to dump coal for gas is modified to avoid repeat of winter heating crisis,” August 29, 2018; Reuters, “China plans more nuanced anti-pollution measures in 2019: ministry,” December 25, 2018.
- International Energy Agency, Coal 2019, pages 16-18.
- U.S. Energy Information Administration estimates using growth rates from National Bureau of Statistics of China, “Statistical Communiqué of the People’s Republic of China on the 2018 National Economic and Social Development,” February 28, 2019.
- Reuters, “China boosts coal mining capacity despite climate pledges,” March 26, 2019; International Energy Agency, Coal 2019, pages 32-33; International Energy Agency, Coal 2018ss, pages 32-33.
- International Energy Agency, Coal 2019, pages 31, 110, 123-124; Xinhua News, “Haoji Railway for coal transportation opens to traffic,” September 29, 2019.
- U.S. Energy Information Administration; Global Trade Tracker (accessed March 2020).
- Reuters, “China to cap 2019 coal imports to help domestic producers,” April 9, 2019; Reuters, “China’s 2019 coal imports set to rise more than 10%: analysts,” October 22, 2019; International Energy Agency, Coal 2019, page 56.
- Reuters, “China’s coal imports surge, but prices tell a better story: Russell,” February 14, 2019.
- Global Trade Tracker (accessed February 2020).
- U.S. Energy Information Administration, International Energy Statistics.
- China Daily, “Power market tipped for record 2018,” January 11, 2019; International Energy Agency, Coal 2018, page 19 and Coal 2019, page 16; Reuters, “China’s 2018 coal usage rises 1 percent, but share of energy mix falls,” February 27, 2019; Reuters, “Chinese power consumption climbed over 6 percent in 2017: NEA” January 21, 2018.
- National Bureau of Statistics of China, “Statistical Communiqué of the People’s Republic of China on the 2019 National Economic and Social Development” February 28, 2020; National Bureau of Statistics, National Data (accessed April 2020); Xinhua News, “China’s power use up 4.5 pct in 2019,” January 25, 2020.
- Reuters, “Electric shock: China power demand drops as coronavirus shutters plants,” February 14, 2020.
- U.S. Energy Information Administration estimates using growth rates from International Energy Agency, World Energy Statistics 2019.
- Reuters, “China Energy to expand ultra-low emission coal-fired power: executive,” July 18, 2019.
- International Energy Agency, Gas Market Report 2019, page 20; China Daily, “China to cap coal consumption at 4.1 billion tons by 2020,” January 18, 2017.
- U.S. Energy Information Administration, International Energy Statistics.
- U.S. Energy Information Administration, International Energy Statistics.
- T&D World, “World’s Biggest Ultra-High Voltage Line Powers Up Across China,” January 2, 2019; South China Morning Post, “China’s under-utilised ultra-high-voltage power lines no silver bullet to rid grid of bottlenecks,” February 14, 2016.
- U.S. Energy Information Administration estimates.
- PV Magazine, “China sets lower solar FIT rates for 2018,” December 22, 2017.
- U.S. Energy Information Administration estimates; National Bureau of Statistics of China, “Statistical Communiqué of the People’s Republic of China on the 2018 National Economic and Social Development,” February 28, 2019.
- International Atomic Energy Agency, Power Reactor Information System, Country Statistics, China and Under Construction Reactors (website accessed August 2020) and World Nuclear Association, “Nuclear Power in China,” Updated August 2020; World Nuclear Association, Taipingling 1, China.
- International Energy Agency, World Energy Outlook 2019, page 732.
- International Energy Agency, Gas Market Report 2019, page 23.