India Energy Profile: Third-Largest Energy Consumer In World – Analysis
By EIA
India was the third-largest energy consumer in the world after China and the United States in 2018, according to the BP Statistical Review of 2019, and its need for energy supply continues to climb as a result of the country’s dynamic economic growth, population growth, and modernization over the past several years.1 After annual inflation-adjusted gross domestic product (GDP) growth rose each year between 2011 and 2016, reaching nearly 8.2%, India’s GDP growth slowed to about 5.0% in 2019, according to India’s government data and the World Bank.2
The slowdown was initially a result of government-led demonetization and the goods and services tax reform, implemented between the end of 2016 and mid-2017, and insufficient private sector investment.3 In 2019, the economy struggled with a financial and lending crisis, consumption and investment declines, and regulatory issues.4
The outbreak of the coronavirus (COVID-19) in India that began at the start of 2020 and the country’s ensuing national lockdown from late March through mid-May to stop the spread of the virus has adversely impacted industrial and economic activity, labor mobility, and energy use within India and is likely to push GDP growth much lower in 2020, according to several experts.5
The Bharatiya Janata Party (BJP), which was re-elected as the majority party in May 2019 to govern India for the following five years, continues to face several challenges to meet the country’s growing energy demand, including securing affordable energy supplies and attracting investment for upstream projects and transmission infrastructure. The government has made considerable headway with energy reforms since the BJP was first elected in 2014, and it pledges to continue focusing on greater energy security, infrastructure development, and market liberalization.
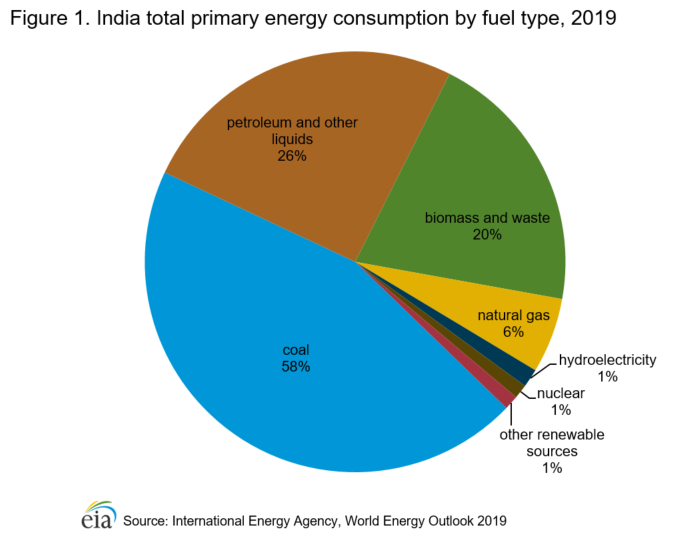
Primary energy consumption in India has nearly tripled between 1990 and 2018, reaching an estimated 916 million tons of oil equivalent.6 Coal continued to supply most (45%) of India’s total energy consumption in 2018, followed by petroleum and other liquids (26%), and traditional biomass and waste (20%). Other renewable fuel sources make up a small portion of primary energy consumption, although the capacity potential is significant for several of these resources, such as solar, wind, and hydroelectricity. The country has moved away from traditional biomass and waste over the past several years as the availability of electricity connections spread for the residential and commercial sectors. Although natural gas accounts for 6% of the country’s energy consumption, India plans to boost the natural gas market share to 15% by 2030 as part of the country’s plan to reduce air pollution and use cleaner-burning fuels.7 (Figure 1)
Petroleum and other liquids
Exploration and production
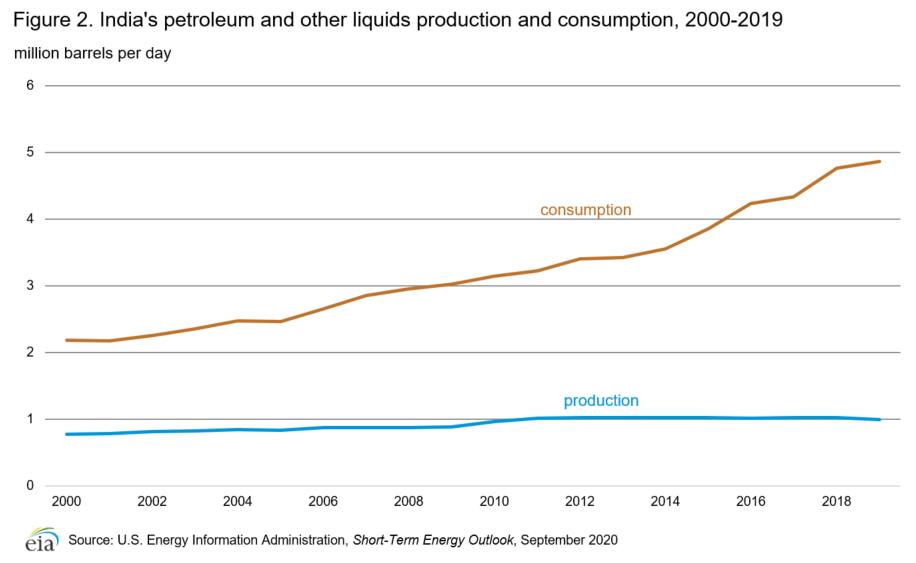
India’s total petroleum and other liquids production has hovered at about 1 million b/d since 2010, although EIA expects production to fall in 2020 (Figure 2). About two-thirds of India’s total liquids production is from crude oil and condensate, which has gradually declined over the past few years and fell 40,000 barrels per day (b/d) to 667,000 b/d in 2019.
The nationwide lockdown in response to the COVID-19 pandemic in India in the second quarter of 2020 has caused labor and equipment shortages for some oil fields and demand destruction, forcing some immediate curtailment of production.
Almost half of India’s crude oil production is from offshore fields, although this share has dropped in the past several years as production from the large, aging Mumbai High field has declined. The only sizeable project expected to come online in the next few years is Oil and Natural Gas Corporation’s 78,000 b/d KG-D5 deepwater oil and natural gas development starting in 2021.8 This project could offset some of the declines in mature fields.
India has struggled to offset production declines of its mature fields because of insufficient investment and technical issues. Domestic crude oil production from many of India’s mature fields and from technically-challenging deepwater developments is cost-prohibitive at low oil prices. India’s government is trying to attract more investment and reduce India’s oil import dependency by improving the contract terms for private and foreign companies and prompting the national oil companies to invest more in upstream development. In early 2019, India further allowed marketing and pricing freedom for all new oil and natural gas fields.9 In addition, India pledged to invest $58 billion in oil and natural gas upstream development by 2023. However, this announcement came just before the oil price crash in early 2020, which could alter investment decisions.10
Consumption
India was the third-largest consumer of crude oil and petroleum products after the United States and China in 2019. The gap between India’s oil demand and supply is widening. Demand for crude oil in 2019 reached 4.9 million b/d, compared to less than 1 million b/d of total domestic liquids production (Figure 2). The economic slowdown and heavy monsoon season eased the pace of India’s oil demand growth, which grew 2% in 2019 compared to the 2018 level.
As of August 2020, EIA expects the ongoing COVID-19 pandemic to drastically lower India’s growth in petroleum products—primarily jet fuel, gasoline, and diesel—with the most acute demand destruction occurring during the second quarter of 2020.11 India’s refiners began curtailing oil product output in March 2020. Once the country’s economy recovers from the pandemic, India’s transportation and industrial sectors is likely to expand under economic development; a rising population; and government policy initiatives that increase highway and airport infrastructure, promote Indian manufacturing, and increase liquefied petroleum gas (LPG) use in the residential sector.12
Diesel remains the most-consumed oil product in India, accounting for 39% of petroleum product consumption in 2019, and is used primarily for commercial transportation and, to a lesser degree, in the industrial and agricultural sectors.13 Gasoline consumption, which accounts for 14% of India’s total oil consumption and has increased at an accelerated rate over the past few years, has been replacing diesel in the swiftly-growing passenger vehicle sector since 2014.14
India has supported LPG consumption through targeted subsidies for the lowest income population since 2016, which is likely to sustain LPG growth through 2020. However, LPG consumption growth began slowing through the first half of 2019, and LPG penetration rate of households reached nearly 97% at the beginning of 2020 compared to 56% in 2016. LPG consumption growth may slow once all households have LPG access.15
Refining
As of 2019, India had 5.0 million b/d of nameplate refining capacity, making it the second-largest refiner in Asia after China (Table 1). The two largest refineries by crude oil capacity, located in the Jamnagar complex in Gujarat, are world-class export facilities and are owned by Reliance Industries. The Jamnagar refineries account for 27% of India’s current capacity.16 Several refiners have incrementally increased the crude oil processing capacity through small expansions at existing facilities. However, bringing on new facilities has been slow over the past few years, and no new projects are slated to come online until the mid-2020s.17
India’s state refiners are upgrading their facilities to comply with a new government requirement to produce oil products with the equivalent of Euro VI emission standards by April 2020.18
| Refinery location | Name of company | Crude refining capacity (1,000 barrels/day) |
|---|---|---|
| Public Sector | ||
| Barauni, Bihar | Indian Oil Corp. Ltd. | 120 |
| Bongaigaon, Assam | Indian Oil Corp. Ltd. | 47 |
| Digboi, Assam | Indian Oil Corp. Ltd. | 13 |
| Guwahati, Assam | Indian Oil Corp. Ltd. | 20 |
| Haldia, West Bengal | Indian Oil Corp. Ltd. | 151 |
| Koyali, Gujarat | Indian Oil Corp. Ltd. | 275 |
| Mathura, Uttar Pradesh | Indian Oil Corp. Ltd. | 161 |
| Panipat, Haryana | Indian Oil Corp. Ltd. | 301 |
| Paradip | Indian Oil Corp. Ltd. | 301 |
| Mahul, Mumbai | Hindustan Petroleum Corp. Ltd. (HPCL) | 151 |
| Visakhapatnam, Andhra Pradesh | Hindustan Petroleum Corp. Ltd. (HPCL) | 167 |
| Mahul, Mumbai | Bharat Petroleum Corp. Ltd. | 241 |
| Kochi, Kerala | Bharat Petroleum Corp. Ltd. | 311 |
| Manali, Chennai | Chennai Petroleum Corp. Ltd. | 211 |
| Nagapattinam, Tamil Nadu | Chennai Petroleum Corp. Ltd. | 20 |
| Numaligarh, Assam | Numaligarh Refinery Ltd. | 60 |
| Mangalore, Karnataka | Mangalore Refinery & Petrochemicals Ltd. | 301 |
| Tatipaka, Andhra Pradesh | Oil & Natural Gas Corp. Ltd. (ONGC) | 1 |
| Joint-Venture | ||
| Bina, Madhya Pradesh | Bharat-Oman Refinery Ltd. | 157 |
| Bathinda, Punjab | HPCL-Mittal Energy Ltd. | 227 |
| Private Sector | ||
| Jamnagar | Reliance Industries Ltd. | 663 |
| SEZ, Jamnagar | Reliance Industries Ltd. | 707 |
| Vadinar, Gujarat | Essar Oil Ltd. | 402 |
| Total | 5,008 | |
| Source: U.S Energy Information Administration, based on India Ministry of Petroleum and Natural Gas Note: SEZ = Special Economic Zone. |
Petroleum and other liquids storage
India is highly dependent on crude oil imports and has been building a strategic petroleum reserve (SPR) to ensure the country does not have supply disruptions and to add to commercial storage the country’s refiners own. India completed its first phase of SPR construction at the end of 2018. The first phase includes three locations (Visakhapatnam, Mangalore, and Padur) and has a total capacity of 39 million barrels, which represents about 10 days of crude oil demand coverage.19 The government launched a second SPR phase in October 2018 and plans to construct another 48 million barrels and add another 12 days to crude oil demand storage.20
To take advantage of low international oil prices and reduce its oil import costs, India had filled more than 270 million barrels in strategic and commercial reserves in tanks, pipelines, and ships by May 2020.21
Trade
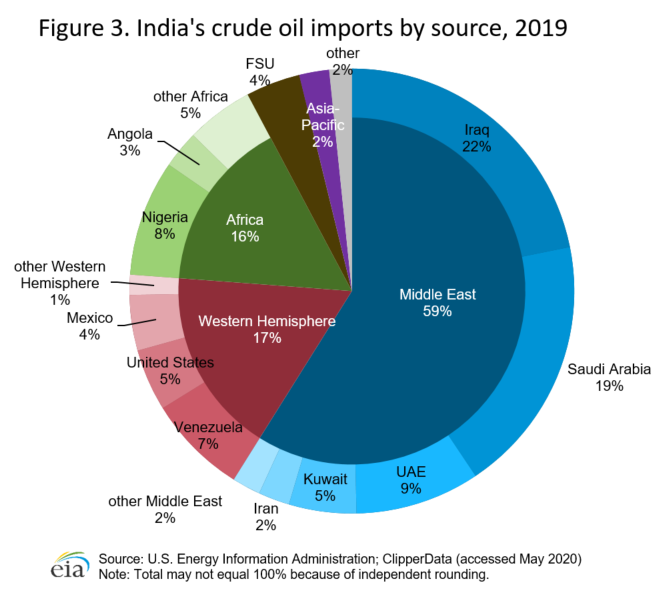
India’s crude oil imports reached 4.4 million b/d in 2019. Iraq recently became India’s largest oil supplier, with a 22% share of India’s crude oil imports. In total, approximately 59% of India’s imported crude oil was from the Middle East, mostly from Saudi Arabia and Iraq. India increased its crude oil imports (including condensates) from Iran in 2016 when the U.S. and European sanctions imposed on Iranian oil exports were lifted. However, India’s imports from Iran fell to zero by June 2019 after the United States reimposed sanctions on Iran’s oil exports (Figure 3). Iran’s share of India’s oil import portfolio fell from 11% in 2018 to 2% in 2019, and other Middle Eastern countries replaced Iran’s shipments.22
Other significant sources of crude oil for India are the Americas (17%) and Africa (16%), mostly from Venezuela and Nigeria. Shares in both of these regions have fallen over the past few years as a result of supply disruptions and declining production in some countries. Albeit small, crude oil exports from the United States to India grew to a 4% share in 2019 from zero in 2016.
Natural gas
Exploration and production
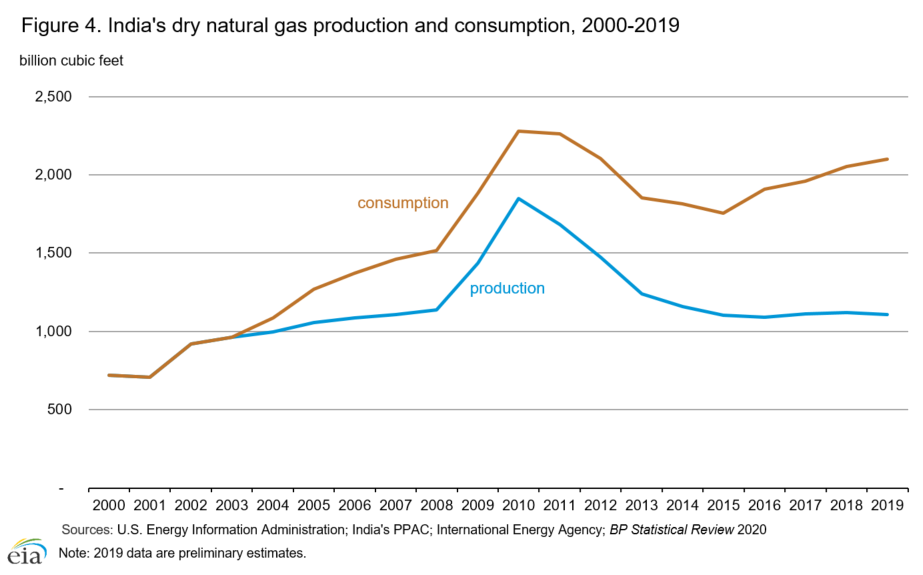
After sharply declining from peak production in 2010, India’s dry natural gas production remained flat at about 1.1 trillion cubic feet (Tcf) between 2015 and 201923 (Figure 4). Production in the first few months of 2020 fell substantially from the year before because of the COVID-19 pandemic and the national lockdown on domestic natural gas demand. Producers have shut in some natural gas as the market has retracted.24
As a result of the government’s major upstream policy change implemented in 2016, companies have invested in more exploration and production for technically challenging natural gas fields (mainly unconventional and deepwater basins). These policy changes gave companies more pricing freedom by allowing them to market natural gas at higher prices to all sectors. Companies can also explore and produce unconventional natural gas from existing production contracts at conventional natural gas fields and can bid on all hydrocarbon blocks of interest without waiting for an official government bidding round. These regulatory reforms have attracted some private investment in small marginal, deepwater, and coalbed methane fields and curbed the steep production declines that began in 2010.
The government also plans to provide India’s major state-owned companies with financial incentives to produce more natural gas from more technically challenging fields. As a result, India intends to double the current production by 202225.
Notable projects expected to come online in 2020 are Reliance Industries’ R-Cluster in the KG-D6 block and state-run ONGC’s KG-DWN-98/2 oil and natural gas deepwater project in the KG-D5 block. Both fields are located in the Krishna Godavari Basin, offshore from India’s east coast. The first set of fields from the KG-DWN-98/2 project, which began producing natural gas in March 2020, will reach a peak of 190 billion cubic feet (Bcf) per year and have a 15-year lifespan.26 Reliance Industries’ R-Cluster has a production capacity of 160 Bcf per year and a 13-year lifespan, and it is slated to come online by late 2020.27
Consumption
Falling domestic natural gas production and insufficient import capacity constrained natural gas demand in India for several years. In 2015, imports began rising, and the country’s natural gas demand rose to 2.1 Tcf in 201928 (Figure 4). Most of the natural gas demand in 2018 came from the power sector (22%), the fertilizer industry (28%), the residential and commercial sectors (17%), and other industrial uses (33%), according to India’s official statistics.29
India’s government supports extension of the natural gas pipeline network and further developing the domestic fertilizer industry, which could bolster more natural gas use. However, renewable energy and coal are formidable competitors to natural gas in the power sector. EIA expects the effects of the COVID-19 pandemic to slow India’s natural gas demand growth, especially in the industrial sector in the first part of 2020.30
Liquefied natural gas and trade
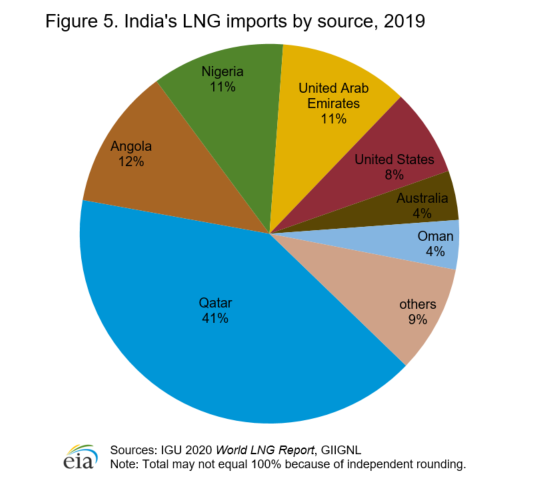
In 2019, India was the world’s fourth-largest LNG importer, importing about 1.2 Tcf (7%) of global trade. During the past two years, India has imported 25% more LNG. Qatar was the primary source of India’s LNG imports with a 41% share, down from 83% in 2014. India has diversified its LNG sources over the past few years and increased its supplies from several African producers, Australia, Oman, and the United States31(Figure 5).
Because India’s natural gas demand has outstripped its production for several years, the country is expected to increasingly rely on LNG imports and build on its natural gas import infrastructure. In mid-2020, India’s total regasification capacity stood at 1.9 Tcf, of which 0.6 Tcf was added since the beginning of 2019. Another 1.0 Tcf is under construction at new terminals and expected to come online by 202232 (Table 2).
As a result of the national lockdown from the COVID-19 pandemic in 2020, India has deferred some LNG cargoes because natural gas demand has contracted since February. The pandemic will likely slow India’s LNG growth in 2020.33
| Project name | Owners | Peak output billion cubic feet per year | Target start year |
|---|---|---|---|
| Existing LNG Terminals | |||
| Dahej | Petronet | 840 | Operational |
| Ratnagiri (Dabhol) | GAIL (31.52%), NTPC (31.52%), MSEB Holding ((16.68%), other smaller companies (20.28%) | 96 | Operational |
| Hazira | Shell | 240 | Operational |
| Kochi | Petronet | 240 | Operational |
| Ennore | Indian Oil Company (95%), Tamil Nadu Industrial Development Corporation | 240 | Operational |
| Mundra | Gujarat State Petroleum Corporation (50%), Adani Group (50%) | 240 | Operational |
| Total | 1,896 | ||
| Projects under construction | |||
| Jaigarh1 | H-Energy | 192 | 2020 |
| Jafrabad LNG Port1 | Exmar (38%), Gujarat Government (26%), Swan Energy (26%), Tata Group (10%) | 240 | 2020 |
| Dharma Port | Adani Group (51%), Indian Oil Corporation (39%), GAIL (11%) | 240 | 2021 |
| Karaikal Port | Atlantic, Gulf and Pacific Company 100% | 48 | 2021 |
| Chhara | Hindustan Petroleum Corp Ltd (50%), Shapoorji Pallonji 50% | 240 | 2022 |
| Total | 960 | ||
| 1Floating Storage Regasification Unit that receives and converts the LNG offshore. | |||
| Sources: International Gas Union, 2020 LNG Report; S&P Global Platts; Reuters; The Financial Express; Offshore Technology; BusinessWire34 |
Pipeline infrastructure
India’s government is keen to develop the country’s natural gas infrastructure, including long distance pipelines, regasification terminals, and distribution stations for using more compressed natural gas in the transportation sector. The government’s goal is to increase the slate of natural gas to a 15% share of the country’s total energy consumption by 2030.35
Insufficient pipeline infrastructure and lack of a nationally integrated system are key factors that constrain natural gas supply in India, although GAIL (India’s state-owned pipeline transmission and distribution company) and other companies are investing in several pipeline projects. The country’s onshore natural gas pipeline network was approximately 10,400 miles in 2018, which was more than double the level in 2008.36 GAIL is constructing another 2,600 miles of pipelines in the northeast and southern regions to provide natural gas access to markets from the underutilized Kochi LNG terminal. The pipeline from Kochi LNG is slated to come online in 2020.37 The newly commissioned Ennore LNG terminal, India’s first on the east coast, will remain underutilized until 2023, when industry sources expect the pipeline linking it to customers in three southern states to come online.38
Coal
Consumption
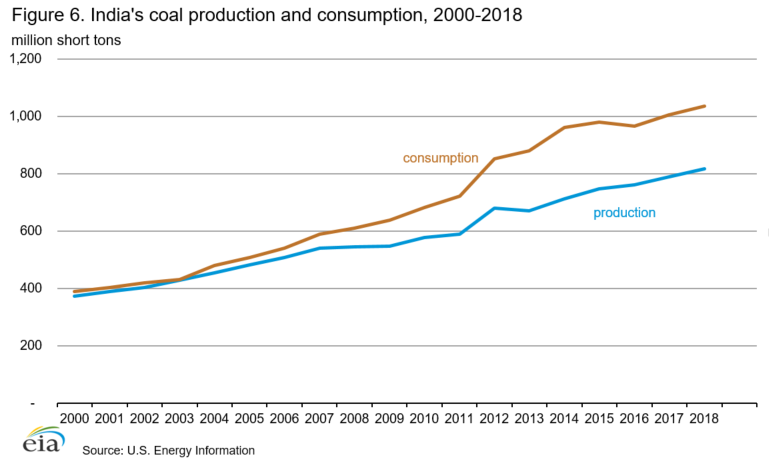
In 2018, India’s coal consumption increased to an estimated 1,037 million short tons, up 3% from 201739 (Figure 6). India’s coal consumption, the second-largest in the world behind China, is driven by the power sector, which makes up about two-thirds of consumption, iron and steel industries, and cement production. Greater connection to the electricity grid for the rural population, industrial growth, and the government’s massive infrastructure program have contributed to higher coal growth in the past two years in 2017 and 2018.40 India’s coal consumption growth slowed in 2019 as a result of slower growth in electricity demand, more fuel substitution from renewable sources, and economic easing.41 Coal-fired power plants are facing competition from growing renewable-based sources, which could ease the growth of coal use in the power sector in the next several years.
India’s coal demand in 2020 is likely to be determined by the magnitude of the COVID-19 pandemic in India and its impact on the electricity and industrial demand growth. The national lockdown in the first half of 2020 has significantly decreased electricity production and halted many construction projects that rely on coal as a fuel.42
Exploration and production
India ranks as the second-largest coal producer in the world on a volumetric basis. India’s coal production increased to 817 million short tons in 2018, up 3% from 2017, mainly reflecting higher investments by the large state-owned coal companies and improved mining efficiency and production43 (Figure 6). Preliminary estimates indicate that coal production by the main producers declined in 2019 because of significant mine flooding from a heavy monsoon season and a series of labor strikes.44
India continues to experience supply shortages and systemic problems with its mining industry. Many coal deposits are located in areas that have environmental challenges or involve potential dislocation of people. Regulatory hurdles continue to impose delays in obtaining environmental and land acquisition approvals for mining companies. In addition, the coal industry continues to rely heavily on rail (about 50% of coal production) to transport coal to demand centers. Insufficient rail capacity and a monopoly on transportation costs could slow India’s coal production.45
In efforts to bolster investment in India’s coal development and allow the country to rely less on imports, the government passed policies in 2018 and 2019 to promote competition in the sector and break the market control primarily held by Coal India Limited. The policies allow local and foreign private companies to produce and sell coal at market prices. The government intends to invite the first bids for foreign firms in 2020.46
Trade
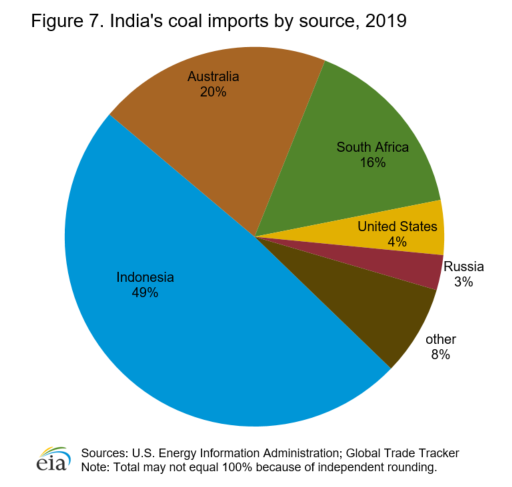
Because coal output cannot keep pace with demand, particularly from the power sector, India has met more of its coal needs with imports than domestic production. In 2019, India purchased 275 million short tons of coal from overseas, making it the second-largest coal importer after China. Coal imports grew by 10% from 2018 levels and have been increasing since 2016.
Indonesia was the largest source of coal imports to India in 2019, accounting for 49% of total coal imports. Other major sources are Australia (20%) and South Africa (16%). India has increased imports from the United States and Mozambique in recent years, although these sources still make up small shares of the overall import portfolio.47 India imports thermal (steam) coal used in power plants mainly from Indonesia and South Africa and coking coal for steel production from Australia48 (Figure 7).
Although India’s government encourages electric power producers to purchase domestic coal over imports during the COVID-19 pandemic and lockdown, logistical and transportation issues will likely not halt all coal imports in 2020. India plans to significantly reduce imports by 2024 and become more self-sufficient in coal.49
Electricity
Because of insufficient fuel supply for power generation and transmission capacity, India suffers from electricity shortages, leading to rolling blackouts. Insufficient investment in the transmission and distribution infrastructure, market inefficiencies, technical problems moving electricity between various states, low electricity tariffs, and financial distress of distribution companies have impaired system reliability. However, India has made strides over the past few years to increase capacity, introduce more renewable energy generation, improve market efficiencies, and enhance electricity access and reliability.
Although electrification rates in India vary by source, based on definitional differences of electricity access, the International Energy Agency estimates that 5% of the population lacked basic access to electricity in 2018. By mid-2018, India’s government announced that it had connected 100% of Indian villages to the electric grid. As of early-2019, real-time tracking data from India’s government reported virtually 100% of rural households in India had electricity. However, electrified areas still suffer from frequent power outages.50 In 2019, the Power Ministry outlined a distribution plan to attain uninterrupted power for all consumers.51
Generation
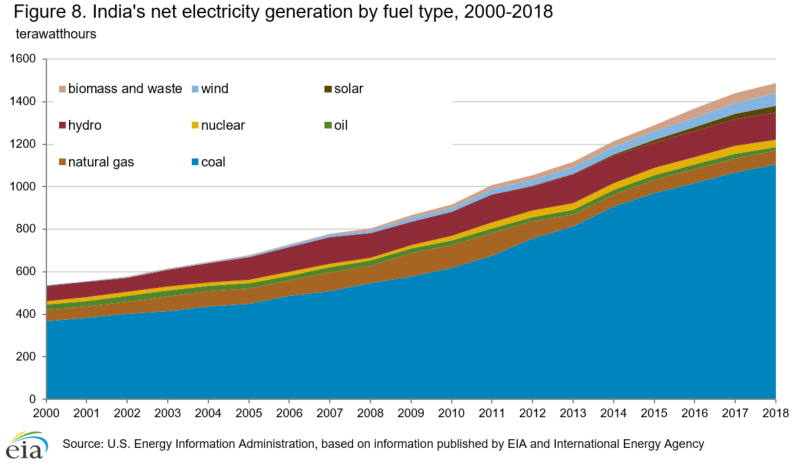
India produced about 1,487 terawatthours (TWh) of net electricity in 2018, up more than 3% from 2017 (Figure 8). The economic and industrial slowdown over the past few years caused a deceleration in India’s power generation since 2018.52 In 2019, EIA estimates that power generation growth has slowed considerably as a result of economic slowdown.53 Further erosion of electricity demand growth is set to occur in 2020 as a result of the effects of the COVID-19 pandemic and the associated national lockdown on India’s economy and industrial output.54
Coal, which accounted for 74% of India’s electric generation in 2018, is the cheapest and most abundant power source for the country. Renewable energy made up the second-largest portion (18%) of power generation and is the fastest-growing power source. Solar energy has increased by an average of 50% each year since 2013. Natural gas, oil, and nuclear power together make up less than 10% of India’s power supply.55
Although coal accounts for the majority of India’s electricity fuel supply, India experiences fuel shortages with coal and natural gas. Utilization rates in India’s coal-fired power plants have fallen steadily since 2007 (from a peak of about 79%) to 56% in 2019.56 Many natural gas-fired power plants remain suspended from operation as a result of domestic natural gas production that fell sharply after 2010 and insufficient infrastructure. Renewable energy production has increased significantly and is taking some market share from fossil fuel-fired power.
Capacity
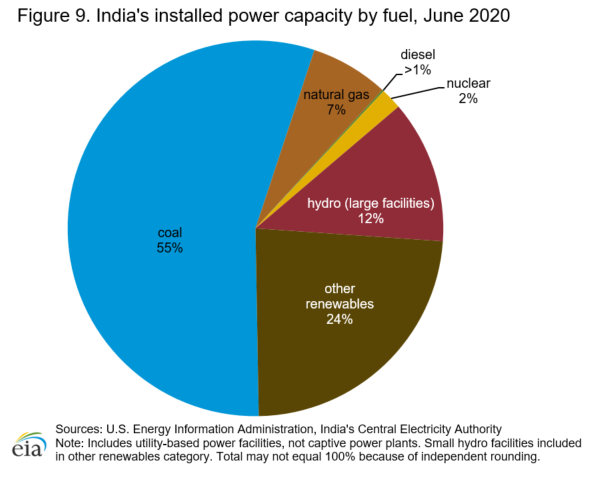
India had more than 370 gigawatts (GW) of utility-based installed electricity generating capacity connected to the national network by June 2020, according to India’s Central Electricity Authority (CEA).57 Coal contributed to most of the capacity (55%). Renewable energy made up a sizeable share of India’s electricity capacity (12% for large hydropower projects and almost 24% for other renewables) and grew in share size over the past several years. Natural gas (7%), diesel fuel (less than 1%), and nuclear power (2%) accounted for much smaller shares (Figure 9). Generation capacity from smaller captive power plants, or those that serve specific industries for in-house consumption and are not connected to the grid, was about 55 GW in 2018.58
As part of India’s goal to reduce emissions and address acute problems of air pollution, particularly in urban areas, and mitigate the use of coal-fired power, the government set a target for renewables other than large hydroelectric plants to increase to 175 GW of capacity by 2022 from about 87 GW in early 2020. Solar and wind power are intended to meet most of this growth.59
India has seven nuclear power plants with a net generation capacity of 6.3 GW, representing about 2% of total utility-based generation capacity. As of August 2020, seven reactors with a combined net installed capacity of 4.8 GW are under construction and several others are in the planning stages.60
Notes
- In response to stakeholder feedback, the U.S. Energy Information Administration (EIA) has revised the format of the Country Analysis Briefs. As of May 2020, updated briefs are available in two complementary formats: the Country Analysis Executive Summary provides an overview of recent developments in a country’s energy sector, and the Background Reference provides historical context. Archived versions will remain available in the original format.
- Data presented in the text are the most recent available as of September 2020.
- Data are EIA estimates unless otherwise noted.
Endnotes
- International Energy Agency, World Energy Outlook 2019, Annexes; BP Statistical Review of World Energy 2019.
- World Bank data, GDP growth (annual %) (accessed April 2020) for 2011-2018; Government of India, Ministry of Statistics and Programme Implementation, Press Note on Provisional Estimates of Annual National Income, 2018-19 and Quarterly Estimates of Gross Domestic Product for the Fourth Quarter of 2018-19, page 1 and Press Note on Provisional Estimates of Annual National Income, 2019-20 and Quarterly Estimates of Gross Domestic Product for the Third Quarter of 2019-20, page 8.
- The Times of India, “Economy shakes off Demonetisation & GST impacts with 6.3% growth,” December 1, 2017.
- CNBC, “India’s GDP growth falls to slowest pace since 2013,” November 29, 2019; CNBC, “India has to clean up its finance sector ‘fast’ to see stronger growth, ex-central bank chief says,” October 31, 2019; International Monetary Fund, 2019 Article IV Consultation with India, Country Report 19/385, December 2019.
- Economic Times, “Labour shortage may break supply chain in Coronavirus lockdown extension,” April 10, 2020; National Public Radio, “India Extends Nationwide Coronavirus Lockdown By 2 Weeks,” May 1, 2020; Forbes, “Coronavirus To ‘Ravage’ India’s Economy With Slump To 1% GDP Growth Forecast–Report,” April 3, 2020; International Monetary Fund, World Economic Outlook, April 2020: The Great Lockdown, April 2020.
- International Energy Agency, World Energy Outlook 2019, page 734.
- The Economic Times, “India’s plan to raise natural gas share in energy basket to 15% looks increasingly ambitious: WoodMac,” February 8, 2019; International Energy Agency, Gas 2019, page 31.
- FACTS Global Energy, Asia Pacific Petroleum Databook 1: Supply and Demand, Spring 2019, page 70; Business Standard, “ONGC postpones KG basin project to Dec 2019; oil production by March 2021,” July 8, 2018; The Economic Times, “ONGC starts pumping gas from KG block,” March 17, 2020.
- The Economic Times, “Govt overhauls oil, gas exploration policy; no profit to be charged on output in less explored areas,” March 11, 2019; International Energy Agency, Gas 2019, page 162.
- The Economic Times, “India to see $118 bn investment in oil, gas sector in next few years: Pradhan,” October 14, 2019.
- U.S. Energy Information Administration, Short-Term Energy Outlook, May 2020.
- Times of India, “Highway construction touched 30 km/day in 2018-19,” April 4, 2019; International Energy Agency, Oil Market Report, July 2019, page 13; Business Standard, “Reliance’s Jamnagar refinery cuts crude processing by 24% as demand slumps,” April 23, 2020.
- India’s Ministry of Petroleum and Natural Gas, Petroleum Planning and Analysis Cell, Petroleum Consumption; FACTS Global Energy, Asia Pacific Petroleum Databook 3: Oil Product Balances and Prices, Fall 2019, page 39.
- FACTS Global Energy, Asia Pacific Petroleum Databook 1: Supply and Demand, Fall 2019, page 37; FACTS Global Energy, Alert, “Demystifying India’s 1H Road Fuel Demand Growth,” July 31, 2019.
- The Economic Times, “LPG coverage 96.9 per cent as on Jan 1, 2020: Dharmendra Pradhan,” February 5, 2020, International Energy Agency, Oil Market Report, August 2019, page 13.
- India Ministry of Petroleum & Natural Gas, Refining, About Refining (accessed April 2020); FACTS Global Energy, Databook 2: Asia Pacific: Refinery Configuration & Construction, Fall 2019, page 64.
- FACTS Global Energy, Databook 2: Asia Pacific: Refinery Configuration & Construction, Fall 2019, pages 27-29; International Energy Agency, Oil 2020, page 113.
- FACTS Global Energy, Databook 2: Asia Pacific: Refinery Configuration & Construction, Fall 2019, page 27; Newsbase, AsianOil, “IOC’s profits slip in April-June quarter,” August 7, 2019, page 6.
- Indian Strategic Petroleum Reserves Limited (accessed May 2020)
- The Economic Times, “India seeks investors for building 2nd phase of strategic oil reserve,” October 17, 2018; S&P Global Platts, “Interview: India can battle geopolitical turbulence by expanding oil storage, says SPR chief,” October 15, 2019.
- Reuters, “India stockpiles low-cost oil, fills 32 million tonnes of commercial storage,” May 4, 2020; The Economic Times, “Lack of space at India’s SPR an opportunity lost: Platts,” April 22, 2020.
- ClipperData (accessed April 2020); Global Trade Tracker (accessed April 2020).
- U.S. Energy Information Administration, International Energy Statistics; India’s Ministry of Petroleum & Natural Gas, Petroleum Planning and Analysis Cell.
- The Economic Times, “India’s natural gas production falls 14% in March as demand dries up, 2019-2020 production lowest in 18 years,” April 23, 2020.
- Business Today, “Govt incentives to ONGC, OIL for natural gas discoveries to boost production,” February 10, 2019.
- The Economic Times, “ONGC starts pumping gas from KG block,” March 17, 2020; The Economic Times, “ONGC projects marginal rise in oil production, cuts gas output guidance from KG block,” November 21, 2019.
- The Economic Times, “Reliance Industries says on track to produce gas from newer fields by mid-2020,” October 21, 2019; The Economic Times, “RIL-BP Unlikely to commence KG Basin production in May,” April 23, 2020.
- U.S. Energy Information Administration; Petroleum Planning and Analysis Cell, Natural Gas, Consumption (accessed July 2019).
- India’s Ministry of Petroleum and Natural Gas, About Natural Gas (accessed May 2020).
- The Economic Times, “India’s natural gas production falls 14% in March as demand dries up, 2019-2020 production lowest in 18 years,” April 23, 2020.
- International Gas Union, 2020 World LNG Report, page 21; International Group of Liquefied Natural Gas Importers, The LNG Industry in 2020, page 18.
- International Gas Union, 2020 World LNG Report, pages 124-129; FACTS Global Energy, East of Suez Gas Databook 2019: Asia Pacific in the Global Gas/LNG Market, India Natural Gas Outlook, September 2019, page 28; BusinessWire, “AG&P Breaks Ground on its LNG Import Facility at Karaikal Port, Puducherry, Expanding Access to Natural Gas for Downstream Customers in South India,” February 20, 2020.
- FACTS Global Energy, Gas/LNG Alert, “Extended COVID-19 Lockdown Hitting India’s LNG Demand Hard in 2Q 2020; Buyer of Last Resort Fades Until 4Q 2020 – 15 April 2020,” April 15, 2020.
- International Gas Union, 2020 World LNG Report, pages 124-129; S&P Global Platts, “India’s Petronet LNG completes Dahej import terminal expansion,” June 11, 2019; Reuters, “FACTBOX-Existing and Proposed LNG terminals in India,” March 14, 2019; S&P Global Platts, “India’s Mundra LNG terminal to receive commissioning cargo Jan 22,” January 22, 2020; Offshore Technology, “Covid-19 could delay progress of upcoming LNG regasification projects in 2020,” March 23, 2020; The Financial Express, “IOC, GAIL pact to take stake in Adani’s Dhamra LNG project expires, no investment made: Dharmendra Pradhan,” July 8, 2019; Reuters, “UPDATE 1-Start-up of H-Energy’s Jaigarh LNG import terminal in India delayed,” June 26, 2019; BusinessWire, “AG&P Breaks Ground on its LNG Import Facility at Karaikal Port, Puducherry, Expanding Access to Natural Gas for Downstream Customers in South India,” February 20, 2020.
- International Energy Agency, Gas Market Report 2019, page 31; The Economic Times, “GAIL to invest over Rs 45,000 cr to create infra for gas-based economy,” January 22, 2020.
- India’s Ministry of Petroleum and Natural Gas, Indian Petroleum and Natural Gas Statistics 2014-15, page 35; Indian Petroleum and Natural Gas Statistics 2017-18, page 44.
- International Energy Agency, Gas 2019, page 33; GAIL, Natural Gas (accessed April 2020); Reuters, “India set to import record LNG volumes as spot prices slump on virus impact,” February 20, 2020; The Times of India, “Natural gas pipeline likely by end of March: Gail,” January 24, 2020.
- S&P Global Platts, “Pipeline delays to keep India’s Ennore LNG terminal underutilized until 2023,” May 21, 2019.
- U.S. Energy Information Administration.
- U.S. Energy Information Administration; International Energy Agency, Coal Report 2018, pages 80-81 and Coal Report 2019, pages 88-90.
- Reuters, “India electricity supply rises after 5 straight months of decline,” February 3, 2020.
- S&P Global Platts, “India lockdown: Government pins hope on domestic thermal coal for power generation amid oversupply,” April 13, 2020.
- U.S. Energy Information Administration; International Energy Agency, Coal Report 2018, page 34 and Coal Report 2019, pages 33-34.
- Reuters, “Coal India’s annual output falls for first time in two decades,” April 1, 2020; Government of India, Ministry of Coal, Monthly Summary for Cabinet.
- International Energy Agency, Coal Report 2019, pages 35 and 112.
- Reuters, “Exclusive: India to invite bids from global coal miners before end of 2019,” September 18, 2019; Reuters, “UPDATE 1-India to ease mining rules from March to spur investment -minister,” January 8, 2020; International Energy Agency, Coal Report 2018, pages 97-98; Coal Report 2019, pages 110-111.
- Global Trade Tracker (accessed April 2020).
- International Energy Agency, Coal Report 2019, page 57.
- The Economic Times, “Lockdown: India’s avoidable coal imports to be brought down to zero,” April 21, 2020; S&P Global Platts, “India lockdown: Government pins hope on domestic thermal coal for power generation amid oversupply,” April 13, 2020.
- International Energy Agency, World Energy Outlook 2019, SDG7: Data and Projections, November 2019; International Energy Agency, Newsroom, “Commentary: Electricity in every village in India,” June 1, 2018; Forbes, “Modi Announces ‘100% Village Electrification’, But 31 Million Indian Homes Are Still In The Dark,” May 7, 2018; India’s Ministry of Power, Saubhagya Dashboard, (accessed July 2019).
- The Times of India, “Power distribution plan soon to ensure 24X7 electricity supply for all,” July 16, 2019; Live Mint, “Govt’s 100-day plan aims to re-energize India’s power sector,” June 12, 2019.
- U.S. Energy Information Administration, based on International Energy Agency’s World Energy Statistics database (accessed August 2019).
- Reuters, “UPDATE 2-India’s electricity demand picks up after being hit by sluggish economy,” February 11, 2020.
- Reuters, “India electricity supply rises after 5 straight months of decline,” February 3, 2020; Reuters, “India’s annual power demand seen falling for first time in almost four decades – Moody’s unit,” April 29, 2020.
- U.S. Energy Information Administration, based on International Energy Agency’s World Energy Statistics database (accessed August 2019).
- International Energy Agency, World Energy Outlook 2015, page 435; The Economic Times of India, “India sees lowest plant load capacity factor in 15 years; power capacities operating at 65%,” May 29, 2015; and India’s Ministry of Power, Central Electricity Authority, Generation Overview Report – Actual, March 2019; Power at a Glance (accessed May 2020); The Hindu Business Line, “Plant load factor for private power companies decline,” December 29, 2019.
- India’s Ministry of Power, Central Electricity Authority, All India Installed Capacity, June 2020.
- India’s Ministry of Power, Central Electricity Authority, Executive Summary on Power Sector, January 2020, page 3.
- The Economic Times, “Why India May Not Achieve its 2022 Clean Energy Target,” November 3, 2019; The Economic Times, “India May Find it Difficult to Meet 175 GW Renewable Energy Capacity Target by 2022, Says Think Tank,” February 12, 2020; International Energy Agency, Coal 2019, page 89.
- International Atomic Energy Agency, Power Reactor Information System (accessed August 2020); World Nuclear Association, “Nuclear Power in India,” (updated July 2020).

