

Variation Across US Gasoline Consumption Estimates: A Guide For The Perplexed
By EIA
Gasoline consumption is a closely watched indicator for analysts who track oil markets and economic activity. However, data and estimates available from a variety of public and private sources often show considerable variation.
The data in EIA’s Petroleum Supply Monthly (PSM) are widely considered to be the most accurate indicator of U.S. gasoline consumption. However, because the PSM is published with a two-month lag, analysts often look at estimates derived from other sources, including EIA’s Weekly Petroleum Status Report (WPSR), to gauge near-term trends in gasoline markets. An understanding of the PSM methodology and its relationship to other calculations can be useful in interpreting differences among alternative estimates.
EIA’s recently released PSM estimates that U.S. gasoline product supplied—a proxy for consumption—averaged 9.2 million barrels per day (b/d) in February, an increase of 6.4% compared with February 2015 (Figure 1). Combined data for January and February show year-over-year growth of 2.8%, which is similar to the 2.7% year-over-year growth in gasoline use for all of 2015.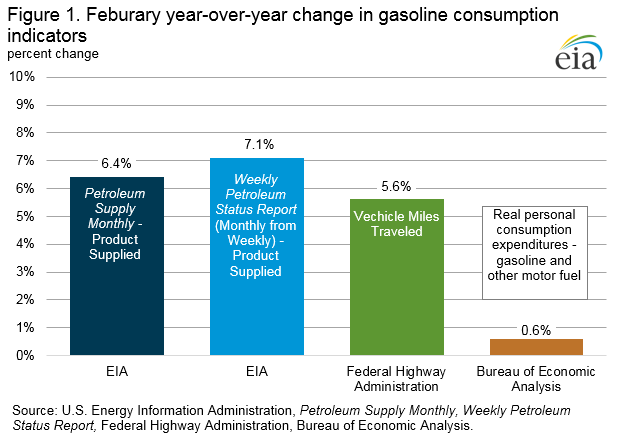
EIA’s gasoline consumption data reflect product supplied, a measure of how much gasoline was supplied from primary levels such as refineries, pipelines, and bulk terminals and blenders. For monthly data, EIA’s PSM surveys all refiners, blenders, importers, pipelines, and primary storage inventory holders. Export data are obtained from a monthly U.S. Census Bureau report based on information from U.S. Customs and Border Protection (CBP). Product supplied is calculated as production (from both refineries and blenders) plus imports, minus exports and primary storage inventory change. Although not a direct measurement of sales at gasoline stations, product supplied is a good proxy for consumption because of how quickly gasoline moves from the primary supply chain to an end user.
For weekly gasoline consumption estimates, the WPSR surveys a sample of refiners, blenders, importers, pipelines, and primary storage inventory holders and calculates product supplied. The companies sampled represent at least 90% of the latest monthly volume for all these supply sources. The WPSR estimates exports using a model based on the latest monthly trade data available from the U.S. Census Bureau, which are often lagged by two to three months.
There are always differences between monthly estimates derived from WPSR data and the final monthly numbers in the PSM. WPSR data for February 2016 implied product supplied averaged 9.3 million b/d, 85,000 b/d (0.9%) above the final PSM number. For the 12 months of 2015, the average absolute value difference in gasoline product supplied between monthly estimates derived from the WPSR data and the monthly data in PSM was 1.1%. The largest difference was 2.5% (in September) and the smallest difference was 0.3% (in February). Thus, WPSR provides useful estimates of gasoline consumption for those who require very near-term information.
Other government agencies also provide information that provides insight into fuel consumption trends. The Federal Highway Administration (FHWA), part of the U.S. Department of Transportation, issues a monthly estimate of vehicle miles traveled (VMT) in its Traffic Volume Trends report. According to the FHWA, the data, based on state-reported hourly traffic count information, are collected at approximately 4,000 continuous traffic counting locations across the nation and are used to estimate the year-over year percent change in traffic for the current month. Estimates are re-adjusted annually to match the vehicle miles of travel from the Highway Performance Monitoring System and are continually updated. Because of the limited sample sizes, FHWA recommends that caution be used with these estimates, as preliminary results are subject to revision. FHWA data for February 2016 released on April 11 showed a year-over-year growth rate of 5.6% in total VMT. In order to estimate gasoline consumption based on VMT, an assumption has to be made about overall vehicle fleet efficiency.
The Bureau of Economic Analysis (BEA), part of the U.S. Department of Commerce, issues a monthly index of gasoline and other motor fuel quantities as a subset of Personal Consumption Expenditures. These estimates cover the personal use of motor fuel for all vehicles owned, leased, and rented by households. The fuels included in the index are gasoline, diesel, and aviation fuel. The indices begin with benchmark year data collected in the U.S. Census Bureau’s Economic Census, which occurs every four years. BEA currently uses 2007 data as the benchmark because of delays in processing the 2012 survey data. To obtain current monthly index estimates, BEA adjusts benchmark year data using growth rates from product supplied calculations from either EIA’s monthly data or, when this is not yet available, EIA’s Short-Term Energy Outlook (STEO). As a final calculation, BEA applies seasonal adjustments to calculated indexes.
While timely (typically published on a one-month lag), the BEA index data have some drawbacks as a proxy for seasonally unadjusted gasoline consumption. For example, they attempt to measure only personal consumption of fuels, rather than total consumption; the current benchmark is nearly 10 years old; the estimates are seasonally adjusted; and the index includes fuels other than motor gasoline.
In addition to government sources, the Oil Price Information Service (OPIS) and MasterCard® provide estimates of gasoline consumption. OPIS issues a weekly Demand Report, which is a gasoline sales survey of roughly 8,000 retail outlets, or about 6.7% of the U.S. total. MasterCard® maintains a data file on the use of its credit card gasoline purchases and makes adjustments for cash transactions and the use of other credit cards. Although these methodologies are timely and attempt a direct measurement of end use demand, both reports have small sample sizes that rely on significant imputations and adjustments. Additionally, each is a subscription service with limited republication rights; therefore, their data, unlike U.S. government data, are not freely available to the public.
EIA plans to improve the accuracy of its most timely publication, the WSPR, by using real-time export data collected by CBP to improve its estimates of weekly exports. Once implemented, this approach should further reduce the already modest differences between WPSR and PSM estimates of gasoline consumption.
U.S. average regular retail gasoline and diesel fuel prices rise again
The U.S. average regular retail gasoline price increased eight cents from the previous week to $2.24 per gallon on May 2, down 42 cents from the same time last year. The East Coast and Midwest prices each increased nine cents to $2.22 per gallon, and $2.18 per gallon, respectively. The Gulf Coast price rose eight cents to $2.00 per gallon, while the Rocky Mountain price increased five cents to $2.17 per gallon and the West Coast price rose four cents to $2.64 per gallon.
The U.S. average diesel fuel price increased seven cents from a week ago to $2.27 per gallon, down 59 cents from the same time last year. The West Coast and Midwest and prices each rose eight cents to $2.36 and $2.23 per gallon, respectively. The East Coast and Gulf Coast prices both increased six cents to $2.31 and $2.14 per gallon, respectively. The Rocky Mountain price rose five cents to $2.26 per gallon.
Propane inventories gain
U.S. propane stocks increased by 0.7 million barrels last week to 71.9 million barrels as of April 29, 2016, 5.3 million barrels (8.0%) higher than a year ago. Midwest inventories increased by 0.9 million barrels, while East Coast and Rocky Mountain/West Coast inventories increased by 0.2 million barrels and 0.1 million barrels, respectively. Gulf Coast inventories decreased by 0.5 million barrels. Propylene non-fuel-use inventories represented 5.1% of total propane inventories.