
India Energy Profile: Third-Largest Energy Consumer In The World – Analysis
By EIA
India was the third-largest energy consumer in the world after China and the United States in 2021 (according to the BP Statistical Review of World Energy 2022) and the second-most populous country, with 1.4 billion people.1 India’s energy needs continue to grow as a result of population growth and modernization.2
India’s real gross domestic product (GDP) had a negative growth of 6.6% in 2020, the first time since 1979 that India’s economy had negative growth.3The outbreak of the COVID-19 pandemic in India that began at the start of 2020 led the economy to contract.4 In 2021, the economy returned to its usual activity levels, and GDP grew by 8.9%.5
India’s government continues to face several challenges to meet the country’s growing energy demand, including securing affordable energy supplies and attracting investment for upstream projects and transmission infrastructure. The government has made considerable headway with energy reforms and continues to focus on greater energy security, infrastructure development, and market liberalization.
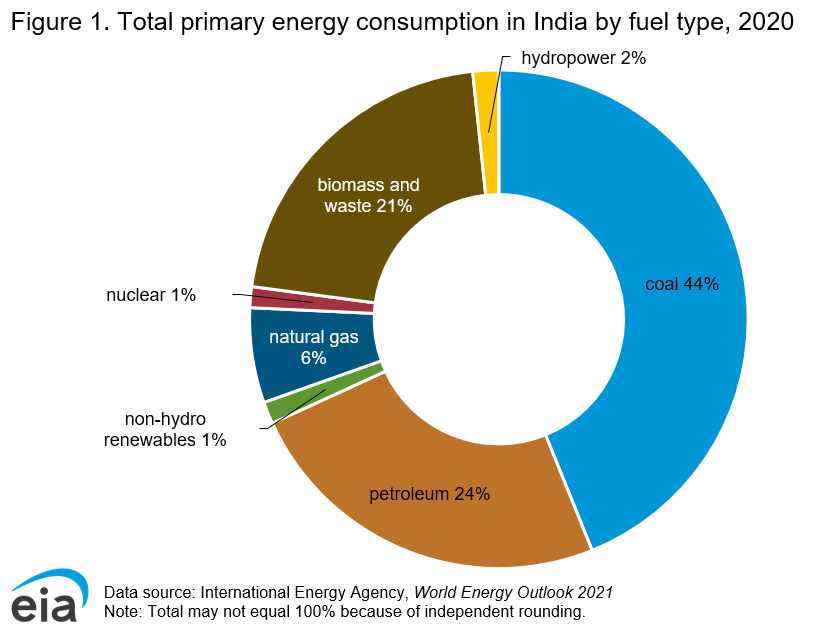
Primary energy consumption in India decreased nearly 6% in 2020 but returned to average levels in 2021, growing by 10%.6 In 2020, coal continued to supply most (44%) of India’s total energy consumption. Petroleum and other liquids accounted for 24% of total energy consumption, and traditional biomass and waste accounted for 21%. Other renewable fuel sources made up a small but growing portion of primary energy consumption (1%), although the capacity potential is significant for several of these resources, such as solar, wind, and hydroelectricity.7 Use of traditional biomass and waste declined over the past several years as the availability of electricity connections has spread for the residential and commercial sectors. Although natural gas accounts for 6% of the country’s energy consumption, India plans to boost the natural gas market share to 15% by 2030 as part of the country’s plan to reduce air pollution and use cleaner-burning fuels8(Figure 1).
Petroleum and other liquids
Exploration and production
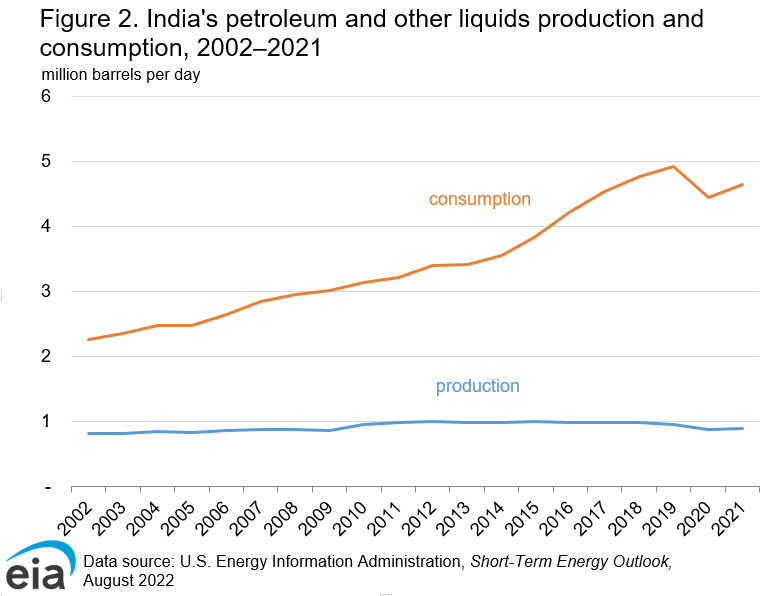
India’s total petroleum and other liquids production remained at about 1 million barrels per day (b/d) from 2010 to 2019. In 2020, production decreased to approximately 890,000 b/d and remained near that level in 2021 (Figure 2). More than two-thirds of India’s total liquid fuels production is from crude oil and condensate. Production of these two fuels fell slightly by 16,000 barrels per day (b/d) in 2021 to 611,000 b/d.9
Almost half of India’s crude oil production is from offshore fields, although this share has dropped in the past several years as production from the large, aging Mumbai High field declined.10 The only sizeable project expected to come online in the next few years is Oil and Natural Gas Corporation’s (ONGC) 44,000 b/d KG-D5 deepwater oil and natural gas development. Its start date for oil production was initially in 2020; however, after several delays, the date was pushed back to the second half of 2022. This project could offset some of the declines in mature fields.11
India’s government is trying to attract more investment and reduce India’s oil imports by improving the contract terms for private and foreign companies and prompting the national oil companies to invest more in upstream development. In 2021, India permitted 100% foreign direct investment in upstream projects. In addition, ONGC has announced it will invest $4 billion in exploration from 2022 to 2025.12
In 2022, the Ministry of Petroleum and Natural Gas announced it will increase the exploration area for oil and natural gas to approximately 310,000 square miles by 2025 and to 620,000 square miles by 2030.13
Consumption
Demand for crude oil in 2021 increased by 5% to 4.7 million b/d as India’s economy returned to pre-pandemic activity levels. Demand for crude oil in 2021 was 270,000 b/d less than the high reached in 201914(Figure 2).
India was the third-largest consumer of petroleum products after the United States and China in 2021. For most petroleum products, growth in 2021 consumption only partially offset the 2020 declines resulting from the response to the COVID-19 pandemic. In 2020, demand for petroleum products—primarily jet fuel (-48%), gasoline (-10%), and diesel (-14%)—decreased as an effect of the pandemic.15
Diesel was the most-used oil product in India, accounting for 35% of petroleum product consumption in 2021, and it was used primarily for commercial transportation and, to a lesser degree, in the industrial and agricultural sectors. Gasoline consumption accounted for 16% of India’s total oil consumption.16
Refining
As of 2021, India had 5.0 million b/d of nameplate refining capacity, making it the second-largest refiner in Asia after China (Table 1). The country’s refining capacity utilization was almost 90% in 2020. The two largest refineries by crude oil capacity, located in the Jamnagar complex in Gujarat, are world-class export facilities and are owned by Reliance Industries. The Jamnagar refineries account for 27% of India’s current capacity.18 Several refiners have incrementally increased their crude oil processing capacity through small expansions at existing facilities. Bringing new facilities online, however, has been slow over the past few years, and no new projects are slated to come online until the mid-2020s.19
India’s state refiners are looking to invest $27 billion to increase refining capacity by 20% by 2025. This goal would raise capacity by approximately 1 million b/d to 6 million b/d.20
| Refinery location | Name of company | Crude refining capacity (thousand barrels per day) |
|---|---|---|
| Public Sector | ||
| Indian Oil Corp. Ltd. | 120 | |
| Bongaigaon, Assam | Indian Oil Corp. Ltd. | 47 |
| Digboi, Assam | Indian Oil Corp. Ltd. | 13 |
| Guwahati, Assam | Indian Oil Corp. Ltd. | 20 |
| Haldia, West Bengal | Indian Oil Corp. Ltd. | 161 |
| Koyali, Gujarat | Indian Oil Corp. Ltd. | 275 |
| Mathura, Uttar Pradesh | Indian Oil Corp. Ltd. | 161 |
| Panipat, Haryana | Indian Oil Corp. Ltd. | 301 |
| Paradip | Indian Oil Corp. Ltd. | 301 |
| Mahul, Mumbai | Hindustan Petroleum Corp. Ltd. (HPCL) | 151 |
| Visakhapatnam, Andhra Pradesh | Hindustan Petroleum Corp. Ltd. (HPCL) | 167 |
| Mahul, Mumbai | Bharat Petroleum Corp. Ltd. | 241 |
| Kochi, Kerala | Bharat Petroleum Corp. Ltd. | 311 |
| Manali, Tamil Nadu | Chennai Petroleum Corp. Ltd. | 211 |
| Nagapattinam, Tamil Nadu | Chennai Petroleum Corp. Ltd. | 20 |
| Numaligarh, Assam | Numaligarh Refinery Ltd. | 60 |
| Mangalore, Karnataka | Mangalore Refinery & Petrochemicals Ltd. | 301 |
| Tatipaka, Andhra Pradesh | Oil & Natural Gas Corp. Ltd. (ONGC) | 1 |
| Joint-Venture | ||
| Bina, Madhya Pradesh | Bharat-Oman Refinery Ltd. | 157 |
| Bathinda, Punjab | HPCL-Mittal Energy Ltd. | 227 |
| Private Sector | ||
| Jamnagar | Reliance Industries Ltd. | 663 |
| SEZ, Jamnagar | Reliance Industries Ltd. | 707 |
| Vadinar, Gujarat | Nayara Energy (Rosneft affiliate) | 402 |
| Total | 5,018 | |
| Data sources: India Ministry of Petroleum & Natural Gas Note: SEZ = Special Economic Zone. |
Petroleum and other liquids storage
India imports most of the crude oil it consumes and has been building a strategic petroleum reserve (SPR) to protect against supply disruptions and to add commercial storage to allow for seamless refinery operations. India completed its first phase of SPR construction at the end of 2018, which consists of facilities at three locations (Visakhapatnam, Mangalore, and Padur) with a total capacity of 39 million barrels. The government approved a second SPR phase in June 2018 and plans to construct another 48 million barrels of capacity at two new locations (Chandikhol and another one at Padur).21 These plans have been delayed until land acquisitions to build the facilities are completed.22
At the end of 2021, India released 5 million barrels from its strategic petroleum reserve in a joint effort to decrease global oil prices.23
Trade
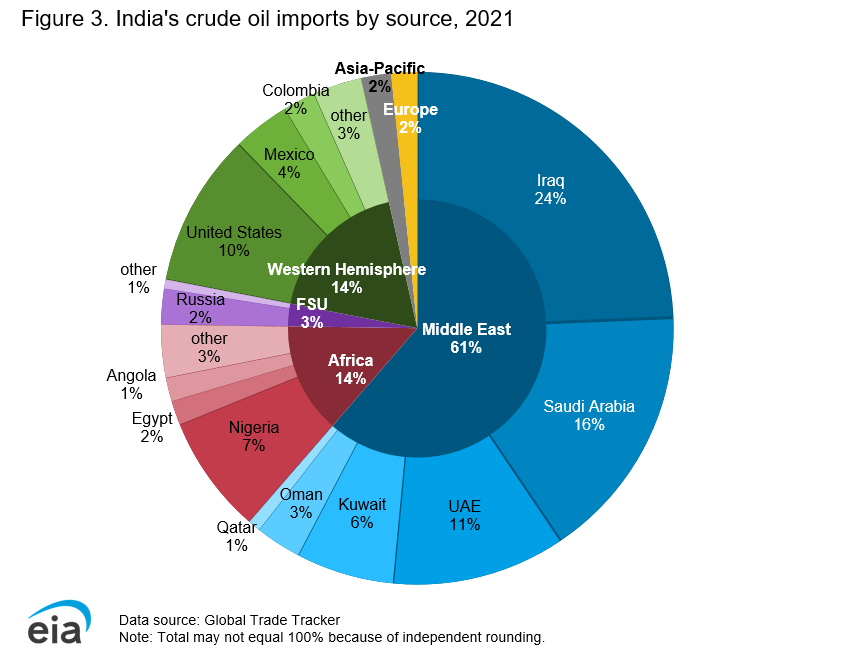
India’s crude oil imports grew by almost 8% from 2020 to 4.2 million b/d in 2021. Iraq is India’s largest oil supplier, providing 24% of India’s crude oil imports. In total, approximately 61% of India’s imported crude oil was from the Middle East, mostly from Saudi Arabia and Iraq (Figure 3). India increased its crude oil imports (including condensates) from Iran in 2016 when the United States’ and Europe’s sanctions on Iran’s oil exports were lifted. In 2020 and 2021, India’s imports from Iran were zero, after the U.S. government re-imposed sanctions on Iran’s oil exports.24
Other significant sources of crude oil for India are from the Western Hemisphere (14%) and Africa (14%), mostly from the United States and Nigeria. U.S. exports to India nearly doubled between 2020 and 2021, accounting for about 5% of India’s total crude oil imports in 2020 and almost 10% in 2021.25
India imported 94,000 b/d from Russia in 2021. India’s imports of oil from Russia increased in 2022 because Russia discounted its oil to promote sales after its full-scale invasion of Ukraine. As a result of the lower cost, crude oil imports from Russia reached a high of 950,000 b/d in June of 2022.26
Natural gas
Exploration and production
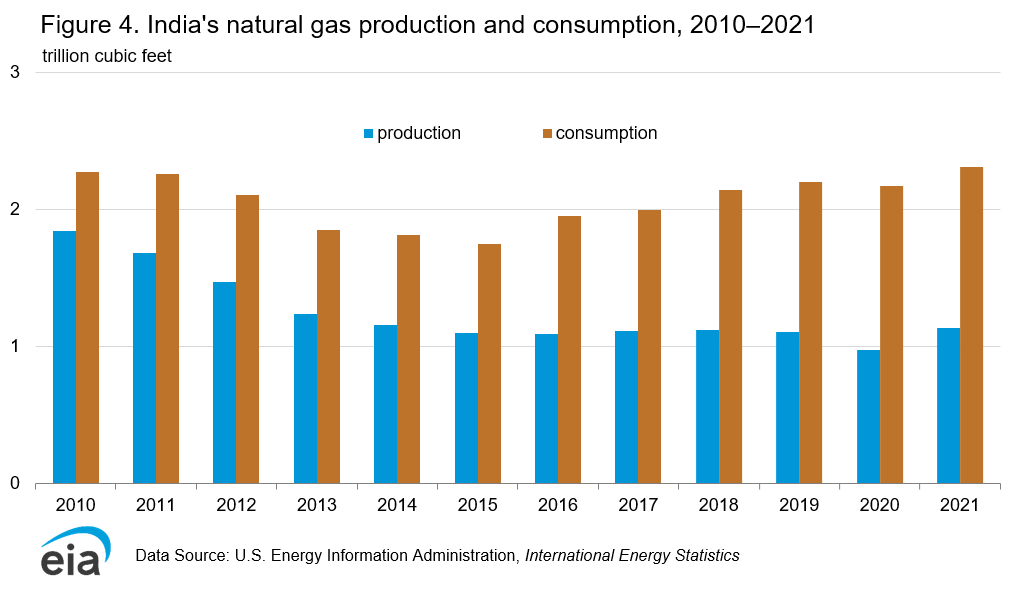
After sharply declining from peak production in 2010, India’s dry natural gas production remained flat at about 1.1 trillion cubic feet (Tcf) between 2015 and 201927 (Figure 4). Natural gas production dropped to just below 1 Tcf in 2020 because of national lockdowns in response to the COVID-19 pandemic before rising back to 1.1 Tcf in 2021.28
India’s government implemented upstream policy changes in 2016, which included giving companies more pricing freedom by allowing them to market natural gas at higher prices to all sectors. Companies can also explore and produce unconventional natural gas, such as coalbed methane and shale gas, from existing production contracts at conventional natural gas fields and can bid on all hydrocarbon blocks of interest without waiting for an official government bidding round. As a result of these changes, exploration and production companies have increased their investments for technically challenging natural gas fields (mainly unconventional and deepwater basins).
These regulatory reforms have attracted some private investment in small, deepwater, and coalbed methane fields and curbed the steep production declines that began in 2010. Even with regulatory reforms intended to promote exploration, of the 225 significant discoveries that have been made in India, the majority (161) are only in the predevelopment phase2.29
A notable project expected to come online in 2022 is Reliance Industries and BP’s MJ project in the KG-D6 block. It is the last of three projects in KG-D6. Combined, these three projects are expected to produce approximately 1 billion cubic feet per day once they reach peak production, according to Reliance.30
Consumption
India’s natural gas demand rose every year since 2015, except for a 1% decrease in 2020, to reach 2.3 Tcf in 202131 (Figure 4). The fertilizer industry used the largest share of natural gas (30%) in 2020.32
India’s natural gas demand grew in 2021, despite pandemic-related disruptions and the effects of increased costs of liquefied natural gas (LNG). Much of this growth can be attributed to the extensive expansion of natural gas distribution infrastructure. The government plans to invest $60 billion in its expansion and aims to connect 70% of the country’s population to the natural gas grid.33
Liquefied natural gas and trade
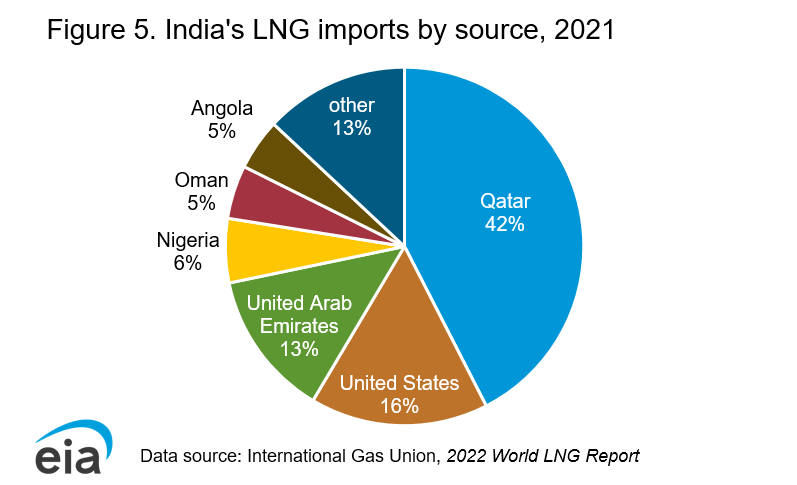
In 2021, India was the world’s fourth-largest LNG importer, importing about 1.2 Tcf (7%) of global trade, a 10% decrease from the previous year (1.3 Tcf). Qatar was the primary source of India’s LNG imports (42%), followed by the United States (16%) and the United Arab Emirates (13%) (Figure 5). The main drivers for the decrease in imports were high LNG spot prices and increased domestic natural gas production.34
In 2022, India’s total regasification capacity was 1.9 Tcf with a 58% utilization rate. As of October 2022, another six projects are under construction (five new terminals and one expansion project) that will add an additional 1.4 Tcf by the end of 202235 (Table 2).
| Project name | Owners | Peak output (billion cubic feet per year) | Target start year |
|---|---|---|---|
| Existing LNG import terminals | |||
| Dahej | Petronet (100%) | 840 | Operational |
| Ratnagiri (Dabhol) | GAIL (31.52%), NTPC (31.52%), MSEB Holding (16.68%), and other smaller companies (20.28%) | 96 | Operational |
| Hazira | Shell (100%) | 240 | Operational |
| Kochi | Petronet (100%) | 240 | Operational |
| Ennore | Indian Oil Company (95%) and Tamil Nadu Industrial Development Corporation (5%) | 240 | Operational |
| Mundra | Gujarat State Petroleum Corporation (50%) and Adani Group (50%) | 240 | Operational |
| Total | 1,896 | ||
| Projects under construction | |||
| Jaigarh1 | H-Energy (100%) | 288 | 2022 |
| Jafrabad LNG Port1 | Exmar (38%), Gujarat Government (26%), Swan Energy (26%), and Tata Group (10%) | 240 | 2022 |
| Dharma Port | Adani Group (51%), Indian Oil Corporation (39%), and GAIL (11%) | 240 | 2022 |
| Karaikal Port | Atlantic, Gulf and Pacific Company (100%) | 48 | 2022 |
| Ratnagiri (Dabhol)—Expansion | GAIL (31.52%), NTPC (31.52%), MSEB Holding (16.68%), and other smaller companies (20.28%) | 384 | 2022 |
| Chhara | Hindustan Petroleum Corp Ltd (50%) and Shapoorji Pallonji (50%) | 240 | 2023 |
| Total | 1,440 | ||
| Data source: International Gas Union, 2022 World LNG Report 1Floating storage regasification unit that receives and converts the liquefied natural gas (LNG) offshore |
Pipeline infrastructure
India’s government considers the development of natural gas infrastructure, including long-distance pipelines, regasification terminals, and distribution stations for using more compressed natural gas in the transportation sector, a priority. The government’s goal is to increase natural gas consumption to a 15% share of the country’s total energy consumption by 2030.36
Insufficient pipeline infrastructure and a lack of a nationally integrated system are key factors that constrain natural gas supply in India, although GAIL (India’s state-owned pipeline transmission and distribution company) and other companies are investing in several pipeline projects. In India’s 2021–2022 budget, the government formalized a plan to set up an independent natural gas transmission system operator. This step is integral to making natural gas more cost competitive; however, the plan does not have a start date.37 The country’s operational natural gas pipeline network was approximately 12,400 miles in 2021, and an additional 9,500 miles are under construction.38
Coal
Consumption
In 2021, India’s coal consumption increased for the first time since 2018. Coal consumption was up 7% in 2021 compared with 2020 to an estimated 988 million short tons39 (Figure 6). India’s coal consumption, the second-largest total in the world behind China, is driven primarily by the electric power sector and, to a lesser extent, the iron and steel industries. Greater connectivity to the electricity grid for the rural population and industrial growth is likely to contribute to continued coal consumption growth.40
India’s government plans to invest $55 billion in coal gasification and liquidation, increasing to 110 million short tons by 2030. The government also has a Methanol Economy program that includes six methanol plants, five of which are based on coal ash.41
Exploration and production
India is the second-largest coal producer in the world on a volumetric basis. India’s coal production increased 6% in 2021 compared with 2020 to 840 million short tons42. Even with the rise in production, India still experienced coal shortages in 2021. Several factors caused the shortages, including increased demand after the pandemic, heavy monsoons that affected mining, and rising prices on imported coal.43
In response to the coal shortages and to reduce imports, India plans to increase coal production to 1.4 billion short tons by the 2024–2025 fiscal year.44 According to the Ministry of Coal,45 55 greenfield projects and 193 brownfield projects are slated to begin production by 2024.
Coal India Limited plans to open 15 coal mines. The company will complete contracts and tenders for all of those mines by the end 2022.46
Trade
India’s coal imports decreased for the second year in a row in 2021, declining 12% from 2020 to 211 million short tons. It remains the second-largest coal importer in the world after China.47 Many factors led to the decrease in imports, including increased domestic coal production, decreased power generation from coal power plants supplied by imports, and the significantly increased price of imported coal.48
Indonesia was the largest source of coal imports in 2021, accounting for over 34% of the total. Imports from Australia increased 55% from 2020 and were slightly less than Indonesia’s share (34%), followed by South Africa (12%) and the United States (7%)49.
As domestic coal production increases, India might offset the need for coal imports entirely by 2024, according to India’s Ministry of Coal secretary.50
Electricity
Because of insufficient fuel supply for power generation and constrained transmission capacity, India sometimes has electricity shortages, leading to rolling blackouts. Insufficient investment in the transmission and distribution infrastructure, market inefficiencies, technical problems moving electricity between various states, low electricity tariffs, and financial problems among distribution companies have impaired system reliability. Despite these challenges, India has made strides over the past few years to increase capacity, introduce more renewable energy generation, improve market efficiencies, and enhance electricity access and reliability.
Although electrification rates in India vary by data source, based on definitional differences of electricity access, the World Bank estimates that 1% of India’s population lacked basic access to electricity in 2020.51 In addition, approximately 40% of urban households and more than 60% of rural households experience power cuts at least once a day.52
Generation
India generated about 1,628 terawatt hours (TWh) of net electricity in 2021, an increase of 8% from 2020. The increase came after demand dropped 2% in 2020 for the first time in at least 39 years, largely as a result of strict lockdowns in response to the COVID-19 pandemic.53
Fossil fuels accounted for 76% of India’s electric generation in 2021. Coal represents the largest share of all energy sources, at 73% of total generation. Coal-fired plants generated 1,243 TWh, surpassing the previous high of 1,208 TWh reached in 2018. Natural gas, oil, and nuclear power together made up less than 7% of India’s power supply.54
Renewable energy made up the second-largest share (21%) of power generation, including hydro power (10%), solar (4%), wind (5%), and biomass (2%).55
Solar energy generation increased 16% in 2021, after averaging a growth rate of 26% the prior two years. Generation from wind energy rose by 15% in 2021. Generation from biomass and waste decreased by 9% after remaining relatively flat from 2018 to 2020.56
Capacity
India had more than 405 gigawatts (GW) of installed electric-generating capacity connected to the national network as of August 2022, according to India’s Ministry of Power. Coal contributed the most capacity (52%). Renewable energy made up a sizeable share of India’s electricity generating capacity (13% for hydropower projects and almost 25% for other renewables) and grew in share size over the past several years. Natural gas (6%), nuclear power (2%), and diesel fuel (less than 1%) accounted for much smaller shares57.
As part of India’s goal to reduce emissions, address acute problems of air pollution (particularly in urban areas), and offset the use of coal-fired power, the government set a target for 50% renewables capacity by 2030, replacing its previous target of 500 GW.58
India has seven nuclear power plants, with a net generation capacity of 6.8 GW, representing about 2% of total utility-based generation capacity. In 2022, eight reactors with a combined net installed capacity of 6.6 GW were either under construction or in the planning stages.59
Source: This article was published by EIA
- Data presented in the text are the most recent available as of November 17, 2022.
- Data are EIA estimates unless otherwise noted.
Endnotes
- BP Statistical Review of World Energy 2022; U.S. Energy Information Administration, International Energy Statistics.
- International Energy Agency, World Energy Outlook 2021, Annexes.
- World Bank data, GDP growth (annual %) (accessed July 2022).
- “Indian Economy Contracts by 6.6 PC in 2020-21.” The Economic Times, 21 Jan. 2022.
- Majumdar, Rumki. “India Economic Outlook.” Deloitte Insights, Deloitte, 12 July 2022.
- BP Statistical Review of World Energy 2022.
- International Energy Agency, World Energy Outlook 2021, Annexes.
- Verma, Nidhi. “LNG’s Share of Indian Gas Demand to Rise to 70% by 2030- Petronet CEO.” Reuters. Thomson Reuters, June 17, 2021; International Energy Agency, World Energy Outlook 2021.
- U.S. Energy Information Administration, Short-Term Energy Outlook, August 2022; U.S. Energy Information Administration, International Energy Statistics.
- Indian Strategic Petroleum Reserve Limited, Annual Report 2020-2021 § (2021), page 25.
- India, Press Trust of. “ONGC Seeks Peak Oil and Natural Gas Output from KG Block in FY24.” Business Standard News. Business-Standard, February 14, 2022.
- “Oil & Gas Industry in India.” India Brand Equity Foundation. Accessed September 26, 2022.
- “Oil & Gas Industry in India.” India Brand Equity Foundation. Accessed September 26, 2022.
- U.S. Energy Information Administration, Short-Term Energy Outlook, August 2022.
- FACTS Global Energy, Asia Pacific Databook 1 Demand, Spring 2022.
- FACTS Global Energy, Asia Pacific Databook 1 Demand, Spring 2022.
- Indian Strategic Petroleum Reserve Limited, Annual Report 2020-2021 § (2021), page 4.
- India Ministry of Petroleum & Natural Gas, Economics and Statistics Division, Indian Petroleum & Natural Gas Statistics 2022-21, February 2022, page 39.
- FACTS Global Energy, Databook 2: Asia Pacific: Refinery Configuration & Construction, Spring 2021, pages 28-29; International Energy Agency, Oil 2020, page 113.
- “Indian Firms Plan to Invest $27 Bln to Boost Refining Capacity by 2025.” Reuters. Thomson Reuters, August 4, 2021.
- Indian Strategic Petroleum Reserve Limited, Annual Report 2020-2021 § (2021), pages 67-69.
- Mishra, Richa. “India Must Boost Oil Storage Capacity.” The Hindu BusinessLine. The Hindu BusinessLine, March 19, 2022.
- “Oil & Gas Industry in India.” India Brand Equity Foundation. Accessed September 26, 2022.
- Global Trade Tracker (accessed August 2022).
- Global Trade Tracker (accessed August 2022).
- Global Trade Tracker (accessed August 2022); Verma, Nidhi. “Russia’s Share of India’s June Oil Imports Surges to Record.” Reuters. Thomson Reuters, July 11, 2022.
- U.S. Energy Information Administration, International Energy Statistics; India’s Ministry of Petroleum & Natural Gas, Petroleum Planning and Analysis Cell.
- U.S. Energy Information Administration, International Energy Statistics.
- Fitch Solutions, India Oil and Gas Report Q3 2022, page 32.
- “Reliance, BP Approve MJ Development Offshore India.” Offshore Energy, September 2, 2022.
- U.S. Energy Information Administration, International Energy Statistics.
- International Energy Agency, Gas Market Report Q3-2022, pages 29.
- International Energy Agency, Gas Market Report Q3-2022, pages 39; International Energy Agency, Gas Market Report Q3-2021, pages 27.
- International Gas Union, 2022 World LNG Report, page 21, 24-25.
- International Gas Union, 2022 World LNG Report, pages 80-81.
- International Energy Agency, Gas Market Report 2019, page 31; Verma, Nidhi. “India’s Gail Sets 2040 Goal for Net Zero Carbon Emissions.” Reuters. Thomson Reuters, August 26, 2022.
- International Energy Agency, Gas Market Report Q1 2021, page 21.
- India’s Ministry of Petroleum and Natural Gas, Indian Petroleum and Natural Gas Statistics 2020-21, page 51.
- U.S. Energy Information Administration, International Energy Statistics.
- U.S. Energy Information Administration; International Energy Agency, Coal Report 2021, pages 23-24; Varadhan, Sudarshan. “Russia Becomes India’s Third-Largest Coal Supplier in July, COALMINT Data Shows.” Reuters. Thomson Reuters. August 4, 2022.
- “Methanol Economy.” NITI Aayog. Accessed September 6, 2022; International Energy Agency, Coal Report 2021, page 24.
- U.S. Energy Information Administration, International Energy Statistics.
- International Energy Agency, Coal Report 2021, page 40.
- Yang, Emma. “India plans to boost coal production to 1.23 bt by FY 2024-25”, September 6, 2022.
- International Energy Agency, Coal Report 2021, pages 40.
- International Energy Agency, Coal Report 2021, pages 41.
- U.S. Energy Information Administration, International Energy Statistics.
- Singh, Animesh. “Coal Imports Fell, Output Rose in 2021-22, Yet States Faced Power Crisis.” NDTV.com. NDTV Profit, March 23, 2022.
- Global Trade Tracker (accessed September 2022).
- “India May Not Need to Import Coal for Generating Electricity by 2024: Union Coal Secretary Anilkumar Jain – ET EnergyWorld.” ETEnergyworld.com, February 16, 2022.
- “Access to Electricity (% of Population) – India.” Data. Accessed September 27, 2022.
- Agrawal et al., “State of Electricity Access in India — Insights from the India Residential Energy Survey (IRES) 2020.” The Council of Energy, Environment, and Water. CEEWS. October 2020.
- U.S. Energy Information Administration, International Energy Statistics; Varadhan, Sudarshan. “India Power Demand Falls for First Time in 35 Years.” Reuters. Thomson Reuters, April 1, 2021.
- U.S. Energy Information Administration, International Energy Statistics.
- U.S. Energy Information Administration, International Energy Statistics.
- U.S. Energy Information Administration, International Energy Statistics.
- “Power Sector at a Glance All India – Ministry of Power.” Accessed September 28, 2022.
- Singh, Sarita C. “India Keeps Renewables Target Flexible, Goal of 500 GW Green Energy by 2030 Dropped.” The Economic Times, August 5, 2022.
- “Nuclear Power in India.” World Nuclear Association, May 2022.