

EIA Raises Crude Oil Price Forecast For 2018 By Nearly $3 Per Barrel – Analysis
By EIA
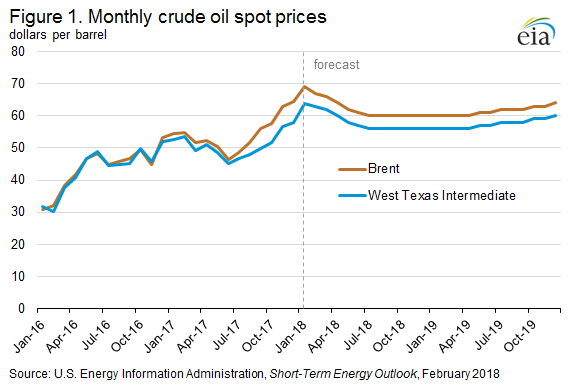
EIA’s February Short-Term Energy Outlook (STEO) raises forecast crude oil prices in 2018 by nearly $3 per barrel (b) compared with the previous STEO. Average monthly Brent prices have increased for seven consecutive months, and, on January 11, spot prices moved higher than $70/b for the first time since December 2014.
EIA forecasts Brent spot prices will average about $62/b in both 2018 and 2019, compared with an average of $54/b in 2017. EIA expects West Texas Intermediate (WTI) crude oil prices to average $4/b lower than Brent prices in both 2018 and 2019 (Figure 1).
The upward revision to 2018 prices results in higher U.S. crude oil production throughout the forecast. However, with relatively little production growth from members of the Organization of the Petroleum Exporting Countries (OPEC) and higher global consumption, the global oil balances remain largely unchanged from the forecast last month.
Crude oil prices have increased over the past seven months as oil inventories, both in the United States and globally, have fallen steadily.
In January, oil prices may have received some support following the OPEC monitoring committee meeting, where some oil ministers suggested extending the production cut agreement in some form beyond the currently scheduled expiration at the end of 2018.
Rapid declines in Venezuelan crude oil output are also likely contributing to higher crude oil prices. Average U.S. imports of crude oil from Venezuela declined to less than 0.4 million barrels per day (b/d) for the four weeks ending January 26, approaching the lowest level in decades.
EIA estimates that U.S. crude oil production averaged 10.2 million b/d in January 2018, up 100,000 b/d from December 2017.
EIA estimates that total U.S. crude oil production averaged 9.3 million b/d in 2017 and will average 10.6 million b/d in 2018, which would mark the highest annual average U.S. crude oil production level, surpassing the previous record of 9.6 million b/d set in 1970. EIA forecasts that 2019 crude oil production will average 11.2 million b/d.
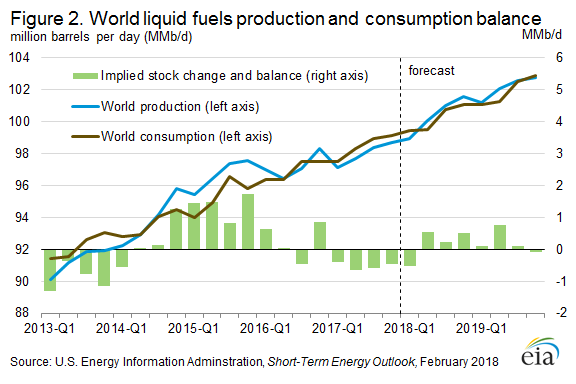
OPEC total liquids production is expected to grow modestly through the forecast period, averaging 39.4 million b/d in 2018 and 39.9 million b/d in 2019. As a result, EIA estimates that global inventories will build by 0.2 million b/d in both 2018 and 2019, indicating that global markets are largely in balance.
 Although EIA expects oil prices to decline in the first half of 2018, the timing and magnitude of price moves are uncertain. Global economic developments and geopolitical events in the coming months have the potential to push oil prices higher or lower than the current STEO price forecast. Uncertainty remains regarding the adherence to and duration of the OPEC and non-OPEC production cuts. Another key unknown in the oil market is the continued dynamism of the U.S. shale sector and how it responds to recent oil price increases with regard to capital outlays and potential input costs escalation. Although the pace of economic growth is forecast to quicken this year, there are both downside and upside risks to that forecast, and significant deviations could influence oil prices.
U.S. average regular gasoline and diesel prices increase
The U.S. average regular gasoline retail price rose 3 cents from the previous week to $2.64 per gallon on February 5, 2018, up 34 cents from the same time last year. West Coast prices increased nearly six cents to $3.15 per gallon, East Coast and Midwest prices each increased nearly three cents to $2.61 per gallon and $2.54 per gallon, respectively, Gulf Coast prices increased two cents to $2.37 per gallon, and Rocky Mountain prices increased over one cent to nearly $2.50 per gallon.
The U.S. average diesel fuel price rose nearly 2 cents to $3.09 per gallon on February 5, 2018, 53 cents higher than a year ago. West Coast prices rose nearly three cents to $3.46 per gallon, East Coast prices rose two cents to $3.13 per gallon, Midwest and Rocky Mountain prices each increased over one cent to $3.04 per gallon and $2.98 per gallon, respectively, and Gulf Coast prices increased less than one cent, remaining at $2.87 per gallon.
Propane/propylene inventories decline
U.S. propane/propylene stocks decreased by 4.1 million barrels last week to 48.9 million barrels as of February 2, 2018, 8.4 million barrels (14.7%) lower than the five-year average inventory level for this same time of year. Gulf Coast, Midwest, and Rocky Mountain/West Coast inventories decreased by 2.2 million barrels, 1.9 million barrels, and 0.2 million barrels, respectively, while East Coast inventories increased by 0.2 million barrels. Propane/propylene non-fuel-use inventories represented 6.1% of total propane inventories.
Residential heating oil prices decrease, residential propane prices flat
As of February 5, 2018, residential heating oil prices averaged $3.20 per gallon, almost 2 cents per gallon lower than last week but 56 cents per gallon higher than last year’s price at this time. The average wholesale heating oil price for this week averaged $2.19 per gallon, 8 cents per gallon lower than last week but 46 cents per gallon higher than a year ago.
Residential propane prices averaged nearly $2.60 per gallon, virtually unchanged from last week but 14 cents per gallon higher than a year ago. Wholesale propane prices averaged $1.14 per gallon, almost 3 cents per gallon less than last week but 15 cents per gallon higher than last year’s price.