

Light At The End Of COVID-19 Tunnel – OpEd
The US Covid-19 pandemic may soon abate. A typical pattern of deaths from Covid-19 within a confined geographic/demographic boundary is characterized by rapid increase of deaths during a 4 to 6-week period followed by gradual decline during a 12 to 14-week period to near baseline. Deaths follow infections from 2.5 to 4-weeks, so rising infections precede rising deaths. The pattern of rapid rise with a sloping tail characterized New York State, New Jersey, Sweden, Lombardy region of Italy, London, and geographic areas where the virus failed to be initially contained (Figure 1).
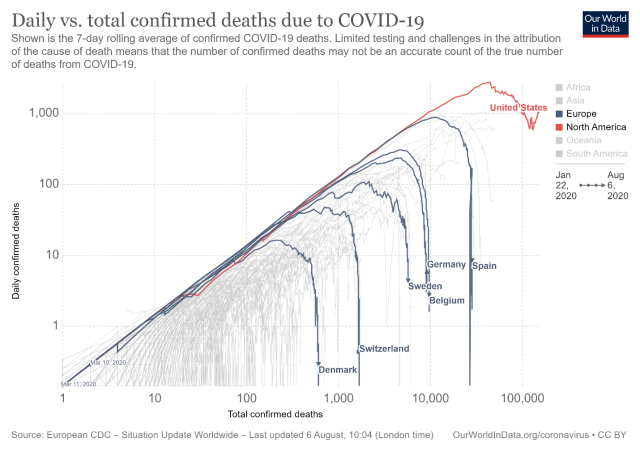
Figure 1: Illustration of rise and rapid fall of daily deaths. Chart is logarithmic, so the increase in deaths is normalized. Graphs are similar for metropolitan regions in the US North East during the initial phase of Covid-19 infections. The same pattern is likely to repeat in yet unaffected populous areas of the US. This continuing spread to “virgin” areas is why the US displays a irregular decline, and in fact, when the graph is updated may show a rise at the tail end before precipitous drop-off.
Who dies?
During the period of uncontrolled spread, the virus gained a wide foothold. A portion of the population appeared immune, another portion had only a mild bout. Most of the population were asymptomatic, particularly youth and young adults. What occurred was that the vulnerable died. A superb graphic from a Danish study titled “Characteristics and predictors of hospitalization and death in the first 9,519 cases with a positive RT-PCR test for SARS-CoV-2 in Denmark: A nationwide cohort” provides a heatmap for risk of death from Covid-19 in the Danish population (Figure 2). The Infection Fatality Rate (IFR) varies by age group and condition. The same clarity of data is not available from the Center for Disease Control and Prevention (CDC) since deaths and comorbidities are reported independently and vary state by state. However, the Danish data provides a reasonable proxy for the US.
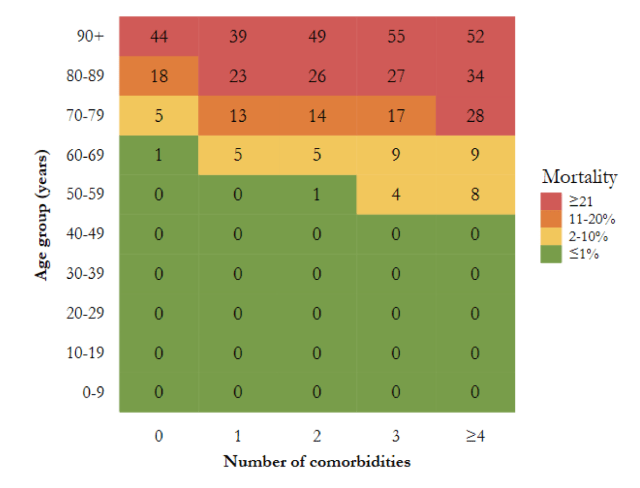
Figure 2. Heatmap illustrating mortality among SARS-CoV-2 PCR positive cases, specified by age and number of comorbidities. “Total number of comorbidities is assessed as the total number of any of the following conditions: Chronic lung disease, hypertension, ischemic heart disease, heart failure, atrial fibrillation, stroke, diabetes, dementia, cancer, chronic liver disease, hospital-diagnosed kidney disease, alcohol abuse, substance abuse, major psychiatric disorder, organ transplantation, overweight and obesity, and rheumatoid arthritis/connective tissue disease (Reilev et al, 2020, p 23).”
The Danish IFR for the 50 to 59 year old cohort with two health challenges is approximately 1.0; for the 60 to 69 year old cohort, approximately 5.0; for the 70 to 79 year old, 14.0; for the 80 to 89 year old, 26.0; and for the 90 to 99 year old, 49.0. The IFR for persons under 50 may be close to the value postulated by John Ioannidis, the Stanford epidemiologist, of 0.28. However, America ranks 46th in longevity among the world’s nations with high incidences of obesity, hypertension, and diabetes. The US is not Denmark. About 40% of US adults are clinically obese, 30% have hypertension, 10% are diabetic, and so the aggregate number of US citizens with “comorbidities” ranges from 20 to more than 50% depending upon age group. Therefore, the IFR for US persons under age 50 likely exceeds that of Denmark.
Need for Reappraisal of Covid-19 Trajectory
The view that herd immunity will be so readily obtained is not in accord with current guidance. The common view persists that herd immunity requires at least 60-80% of a population to be immune to the pathogen. This may be true in a “bounded, freely interacting group” where everybody has access to everybody else, and where every member has the same chance to be infected. But this is not the real world. Two factors mitigate against the “classical herd immunity” view that 60 to 80% of the population must be immune for the virus to stop circulating. The first factor is mathematical modeling of community spread, and the second is individual differences in immune resistance to the pathogen.
Herd Immunity Reconsidered
In the world persons occupy, groups are segmented by geography, occupation, living arrangements, family membership, travel habits, and a host of other variables. Persons that are most likely to be in close contact with a variety of people are most likely candidates to be infected and be carriers of the virus. These are people who take public transportation, meet face-to-face with the public, checkout stations; retail, factory, and office workers in tight quarters; service personnel, participants at conventions, fairs, and workshops, waiters at restaurants, transit police, attendees on cruise ships, hospital personnel, and the like.
In fact, all things being equal, risk can be calculated as a function of number of contacts, time in contact, and spatial distance among them. In the real world, people, high in risk are the people who catch and spread the virus. At the other extreme, homebodies just stay home. The high-risk group spreads the virus among themselves, sometimes “spilling over” into a low-risk demographic, but the low-risk demographic is self-limiting. The high-risk group rapidly infect one another, and like kindling burns brightly then quickly burns out.
A mathematical model of herd immunity divided groups into low interactive, average interactive, and high interactive. When interaction occurred predominantly within groups, the virus–induced herd immunity equaled 43% rather 60%. Proportionally, more persons were infected in groups with high contact than in groups with low contact. Acquired immunity for those most likely to carry the infection was therefore higher, and the overall rate of infection for the general population lower than if immunity was uniformly distributed as in classical herd immunity.
Viral Resistance
Immune responses to the virus include mobilization of T cells, intracellular responses, and production of antibodies. Memory T cells are likely instrumental in warding off infection. Research led by the La Jolla Institute for Immunology detected SARS-CoV-2-reactive CD4+ T cells in approximately 40%–60% of unexposed individuals, “suggesting cross-reactive T cell recognition between circulating “common cold” coronaviruses and SARS-CoV-2.” T cell intervention can confer partial or complete immunity to the Corona virus.
In addition, adaptive intracellular responses restore cellular integrity. A study in the Journal Trends in Pharmacological Sciences, conjectures, “ activation of transcription factor nuclear factor erythroid 2 p45-related factor 2 (NRF2) promotes resolution of inflammation and, in parallel, restores cellular redox and protein homeostasis, and facilitates tissue repair.” Thus, epigenetic variation may trigger intracellular processes to reinstate functionality following Covid-19 infection.
Finally, a great deal of public attention has been directed to antibodies since these are produced as a reaction to the disease and a marker for vaccine development. Types of antibodies and their kinetics appear to differ in symptomatic and asymptomatic persons. Covid-19 antibodies increase with the severity of the illness and wane in the months following illness.
T cell immunity likely provides a first line of defense to Covid-19. An adequate T cell response to the pathogen makes less likely a vigorous antibody response since the pathogen has been neutralized. Persons with compromised T cell production are usually sickest. The 40-60% of persons with T-cell cross-reactivity to Covid-19 likely proportionately increase herd-immunity.
The US Mega-Nation
After spiking in April due to the runaway infections in the New York metropolitan area, US infections trended downward until mid-July. Since the low, deaths approximately doubled into early August. However, deaths remained low in the New York metropolitan area and the North East US. The upward trend is almost entirely due to increased deaths in the South, South Western, and Western US. The demographic groups affected in these states are largely young adults visibly present at beach gatherings, partying, and protests (Figure 3).
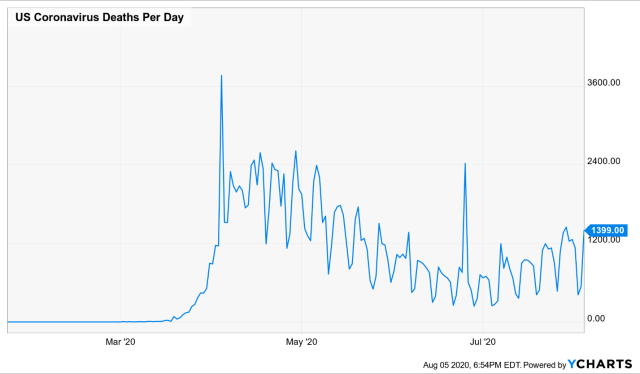
Figure 3: US Covid-19 Deaths. During March and April, deaths rose rapidly in the North East and the NY Metropolitan region, then fell to near baseline. Since early to mid-July, deaths are rising in the South and West, and have yet to decline. The chart sums across these regions. The seesaw variation occurs because deaths are not reported on weekends.
Other developing hotspots include cities in the Midwest and California’s Central Valley. These areas are generally less traveled, working class and farm areas late in exposure to the virus and prone to seasonal changes in work patterns and social aggregation. Poverty and comorbidities are higher among these demographics and so the Infection Fatality Rate (IFR) will be higher.
Earlier cohorts of Covid-19 patients in hospital intensive care units were comprised largely of older adults. Younger patients from the Sunbelt states are less likely to have comorbidities, less likely to die, and more likely to recover with fewer long-term sequelae. As many as 80% are asymptomatic, and most who are ill stay at home. This does not mean that symptomatic young adults escape convalescence or complications as “Covid-19 long-haulers” attest.
But just as in countries and states where Covid-19 was rampant, the pattern of Covid-19 infections follows the same rules: infections quickly spike within 4 to 6 week period followed by a taper to baseline within a 12 to 14 week period. Once this pattern has repeated itself in US locations where infections were low or non-existent, herd immunity will have been established. An infected carrier introduced into a community will not find suitable hosts –except for social isolates and insulated groups.
Conclusion
The US is highly diverse by age, culture, and geography. When partitioned, each group has its own activity level and transmission rate. The upper limit for herd immunity for the US overall is likely to be less than classical herd immunity. This is so because age, culture, and geography provide additional boundaries to interaction with highly proximate groups likely to first acquire and obtain immunity to the virus. These are the past and current hotspots. Hotspots flare-up then retreat.
The protesting, mixing, and partying that has characterized large swaths of the US may reflect a primal adaptation to speed herd immunity. Precisely those groups most likely to spread the virus to less active groups are cleansing their group by sharing the virus among themselves, thereby reducing the likelihood of transmission to the general population. Sequestered groups remain relatively unaffected. Based on mathematical modeling, herd immunity is likely to fall between 40 to 60%. If as research suggests, 40 to 60% of the population possess cross-reactive T cells, immunity is again enhanced by a large fraction. The lower value for herd immunity and the unexpected high incidence for cross-reactive T cell immunity among individuals is consistent with data from serological antibody tests to Covid-19 in the range of 12 to 18 percent found in community studies following return to baseline after rampant Covid-19 infection.
The current round of US Covid-19 infection remains dangerous to susceptible groups. Social distancing, masks, hand-washing, and other precautions ought to be practiced. However, the updated model of herd immunity, and new findings from cross-T cell immunity, mechanisms of cellular resistance, and Covid-19 serology suggest that the Covid-19 fire may soon turn to embers. After the hotspots have been consumed, infectious risk is likely to fall dramatically. Much of ordinary life will resume.
If the timeline for current infections in the US follows the same timeline as the virus followed in other locals, the worst of the Southern and Western flare-ups will have abated by early November. As the virus works its way to communities that have remained unaffected to the present, the virus will have followed its course by the end of March. After that, an occasional flare-up may occur, but without the dire risk attendant to virgin territory. Of course, all this is baring a new variety of the virus that evades earlier immunity, then a new chapter must be written.
*Leland van den Daele, PhD, ABPP is Professor Emeritus of Psychology at the California Institute of Integral Studies in San Francisco, CA. He trained at the American Institute for Psychoanalysis (AIP) in New York City and has taught at University of Illinois, Rutgers University, Columbia University, and California School of Professional Psychology. Leland is a clinical psychologist with interests in culture, character, and social cohesion.