
Debating Defense Budgets: Why Military Purchasing Power Parity Matters – Analysis
By VoxEU.org
US military spending is said to be greater than the next 11 countries combined. However, the conventional use of market exchange rates to compare across countries dramatically overstates US spending relative to other countries. This column introduces a military purchasing power parity exchange rate for 59 countries based on the relative unit cost ratio across counties. This ‘military PPP’ shows that the US military budget in 2019 was smaller than that of the next three largest military spenders – China, India, and Russia – combined.
By Peter Robertson*
In his 2016 State of the Union address, US President Obama claimed that “[t]he United States of America is the most powerful nation on Earth. Period. It’s not even close. We spend more on our military than the next eight nations combined.”
Since then, US military spending has only increased, and today, measured at market exchange rates, it is greater than the next 11 countries combined (Stockholm International Peace Research Institute 2021, Peterson Foundation 2021). This apparent difference makes a mockery of US defence budget requests and of claims that any country poses a significant threat.1
In this column, I show that the perception of the US military ‘spending supremacy’ is misplaced. Specifically, the conventional use of market exchange rates to compare across countries dramatically overstates US real military spending relative to other countries and, likewise, understates the real spending in countries such as China, India, and Russia.
What is military PPP?
The need to adjust for local price differences when making international comparisons of real GDP or standards of living is well recognised. Because relative prices differ across countries, a dollar spent on non-traded goods and services can go a lot further in some countries than in others. This is known as the Penn effect or the Balassa-Samuelson effect, and reflects the fact that the market exchange rate only arbitrages the price of traded goods, so international relative prices of non-traded goods can differ widely from the exchange rate.
The same applies to military spending. Soldiers in the Chinese People’s Liberation Army (PLA), for example, receive far lower salaries than the equivalent US personnel (The Economist 2021). Thus, the PLA’s salary budget, if converted to US dollars at the market exchange rate, would pay for far fewer US army personnel than what it actually pays for in China.2
In response to this, international comparisons of military spending are sometimes made using GDP-purchasing power parity (PPP) exchange rates. These, however, are designed to compare average prices, not military costs; they could overstate military spending since procurement doesn’t necessarily depend on local labour costs (Gilboy and Heginbotham 2012, Frankel 2014).
The alternative views and exchange rate concepts have long been a source of frustration for defence planners, particularly with the enormous variations they imply for China, which has been as much as 200% (Crane 2005).
In fact, neither GDP-PPP exchange rates nor market exchange rates provide the ‘correct’ ratio for converting spending across two countries into real values. The appropriate exchange rate is one that tells us the relative price or unit cost of defence services across countries – that is, a ‘military-PPP’ exchange rate.
The problem in constructing a military-PPP exchange rate is that output prices and quantities of defence services are unobservable and, perhaps unsurprisingly, few countries have shown much inclination to share the necessary input cost data. There is also a problem of substitution bias, which arises because countries will choose different combinations of inputs – such as personnel and equipment – because they have different relative prices.
The challenge, therefore, is to find the best estimate of countries’ real defence budgets given the available data. In Robertson (2021), I construct a military-PPP exchange rate for 59 countries, using publicly available data. Intuitively this breaks down each country’s military budget into three broad categories, personnel, operations, and equipment, and then constructs a relative unit cost ratio across counties for each component. The military-PPP exchange rate is then the average of relative equipment prices; relative wages for personnel, adjusted for skill levels; and the GDP-PPP exchange rate to measures operations costs – where the budget share of each component is the appropriate weight.
Thus, the military-PPP exchange rate will take account of factors such as low salaries for personnel and appropriately weight these costs in the overall defence budget. The approach yields values that can be interpreted as a first-order approximation to the true relative military unit cost ratio, under standard assumptions of cost minimisation and constant returns to scale.3
US military spending is about the same as China’s and Russia’s combined
Looking at military spending this way reveals that real military spending in many countries is indeed far larger than the values implied by market exchange rates. To see this, rather than looking at the US relative to the next eight countries, we can focus on just three other countries – China, India, and Russia.
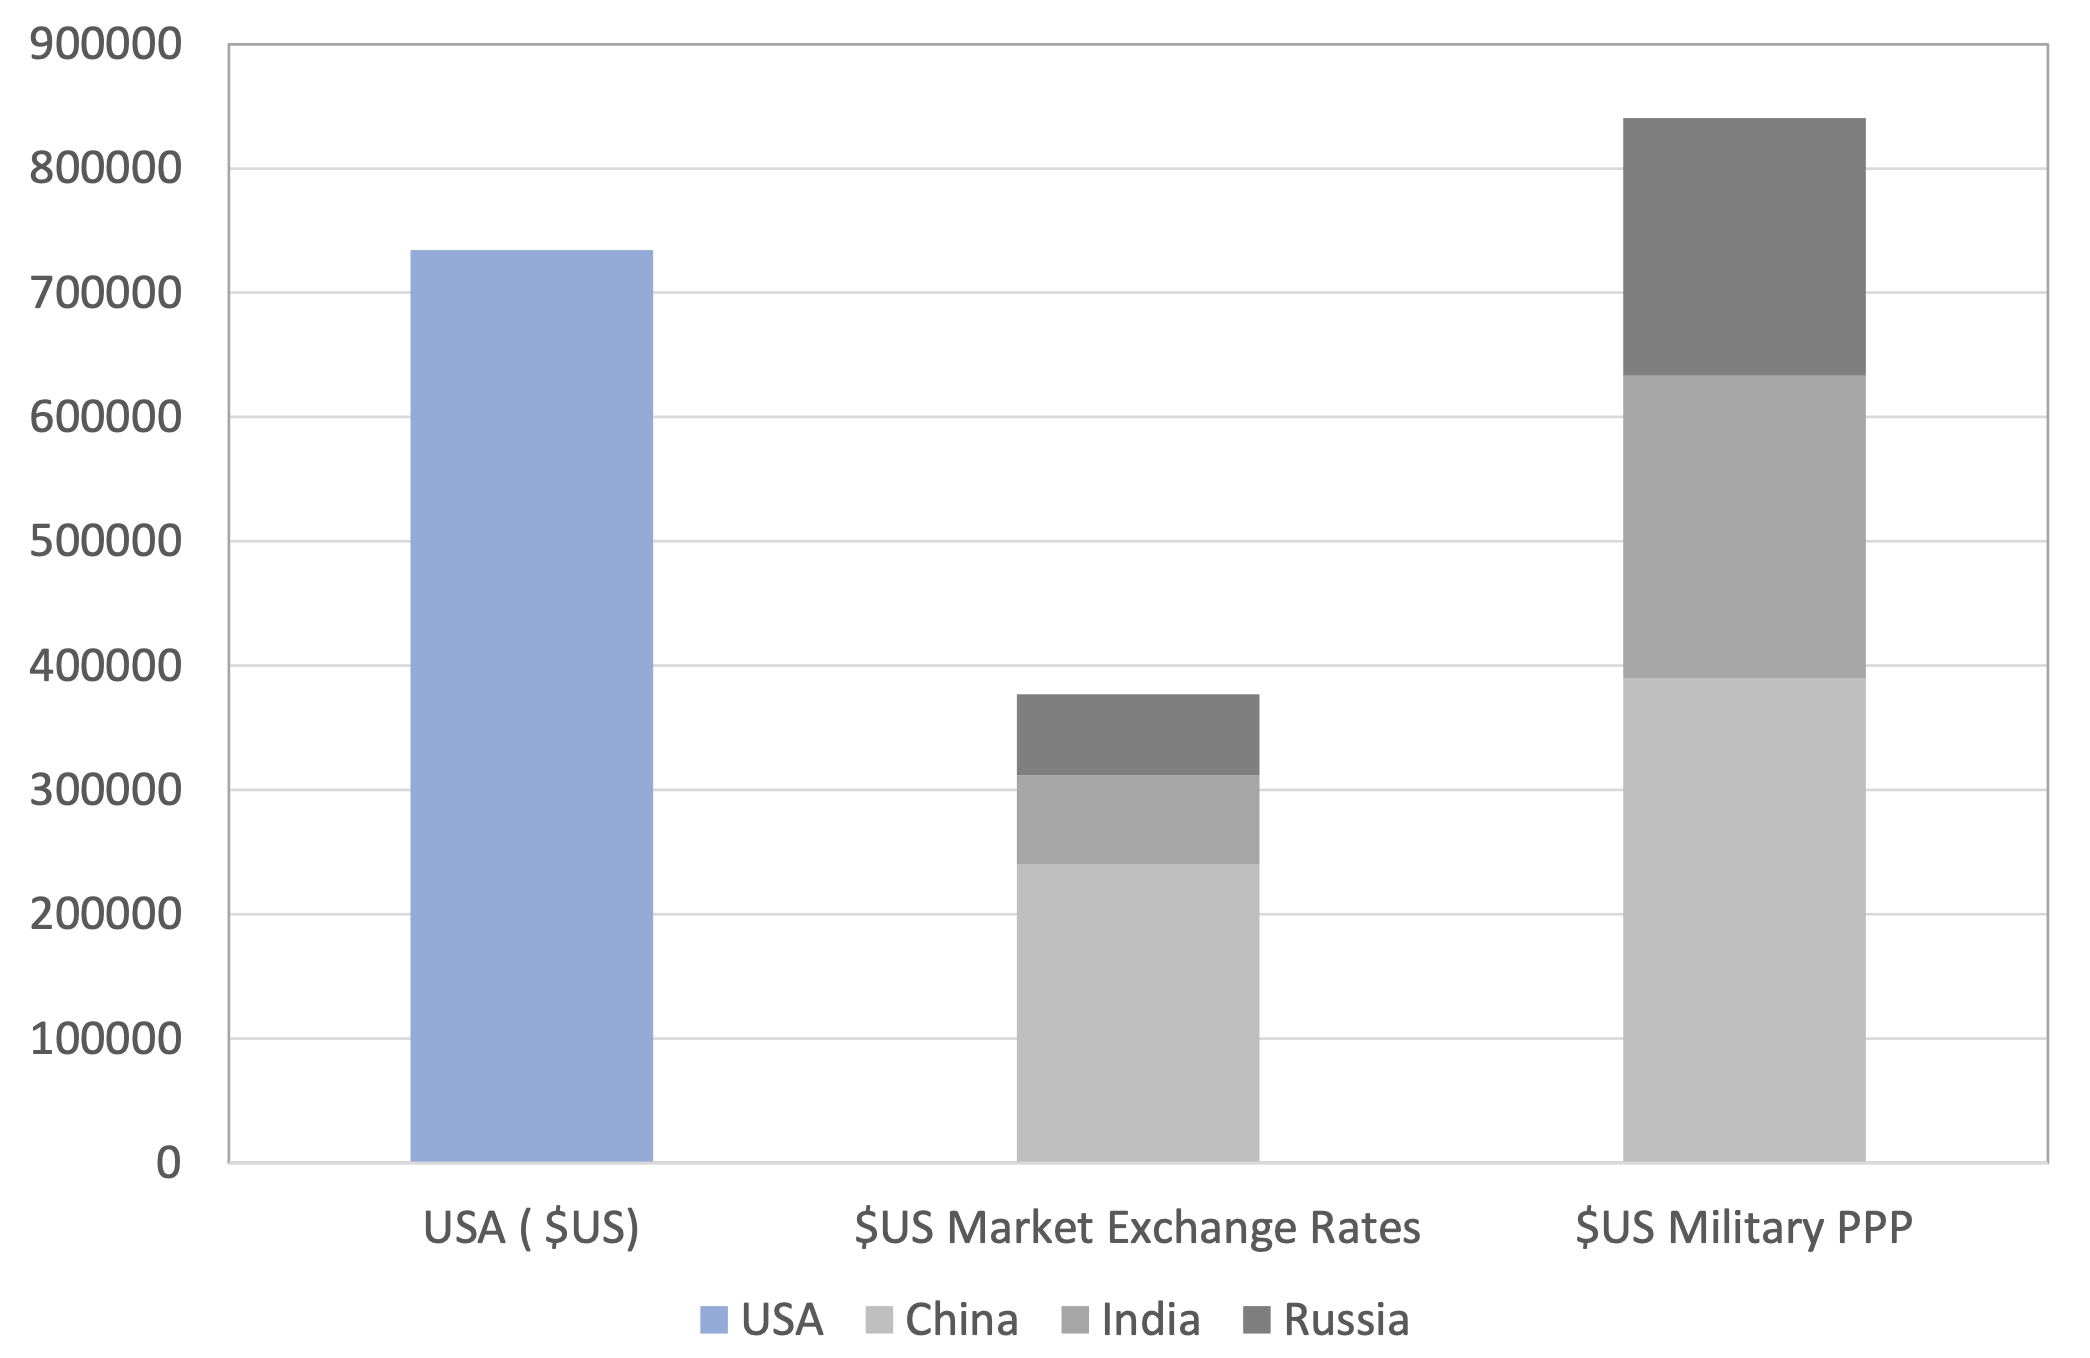
In market exchange rate terms, these three countries have combined military spending in 2019 that amounts to $378 billion, compared to the US’s $734 billion. In military-PPP terms, however, their combined spending is $840 billion (Figure 1). Hence, in real terms, the US military budget in 2019 is not larger than the next eleven countries. Rather it is smaller than the next three and similar to the spending of China and Russia combined.
Figure 1 Military spending in millions of US dollars, 2019 (military-PPP and market exchange rates)
The individual country results for the largest countries are summarised in Table 1. It can be seen that market exchange rates generally underestimate real military spending and that the difference is dramatic. China’s budget in military-PPP terms is 1.62 times larger than the market exchange rate figure. Moreover, India, Russia, and Turkey have budgets that are more than three times the market exchange rate value and some middle-income countries, such as Indonesia and Ukraine, have real military budgets that are 5–6 times the market exchange rate value.
Table 1 Military spending using market exchange rate, GDP-PPP and military-PPP exchange rates, 2019 (millions of US dollars)
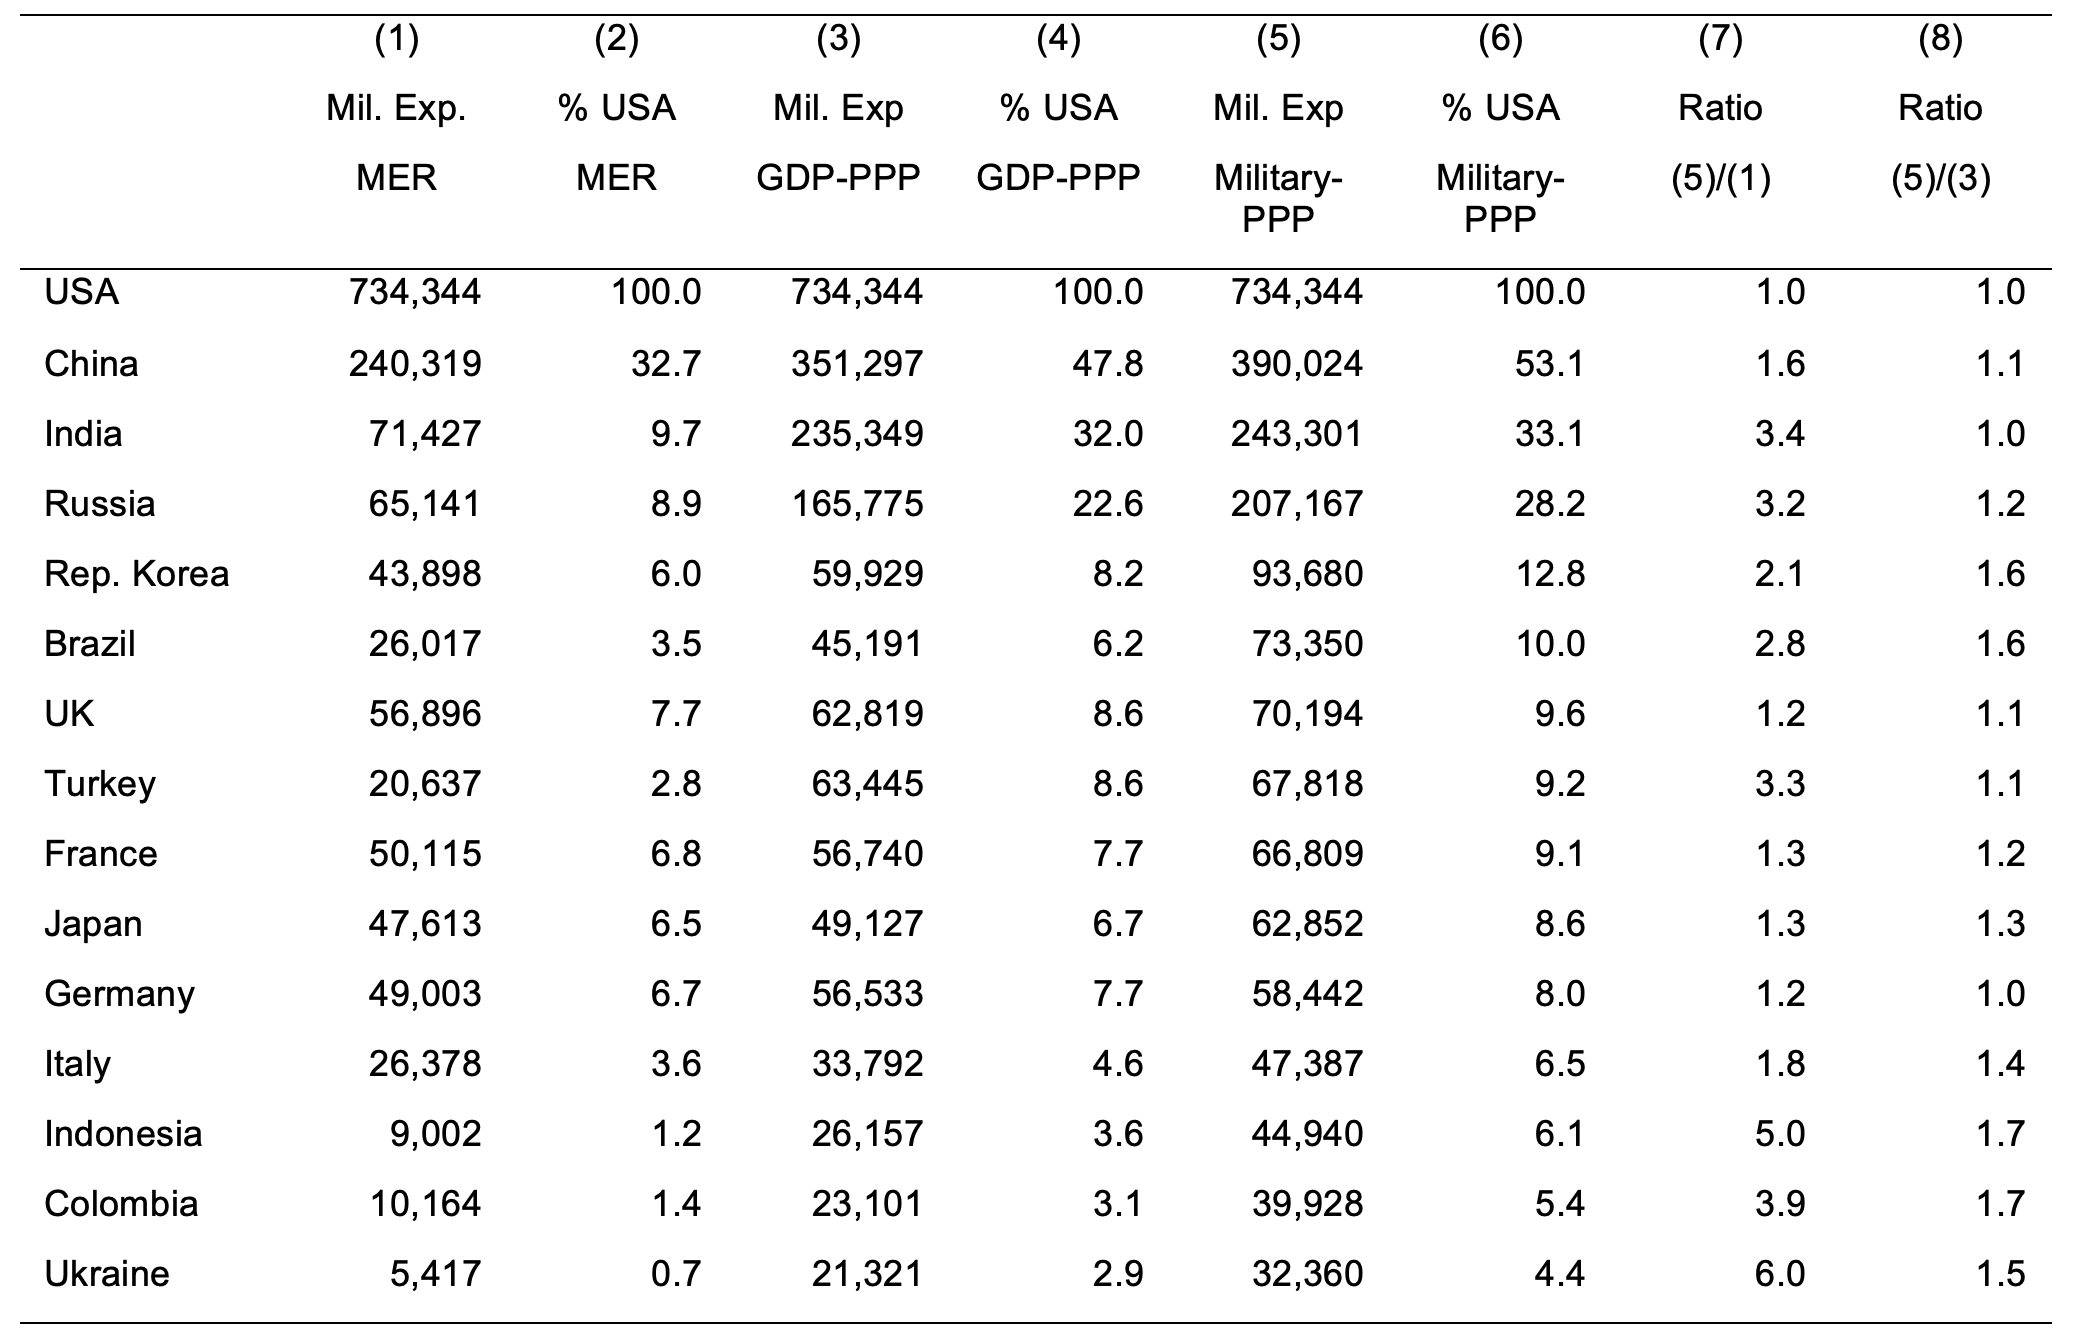
The results show, further, that GDP-PPP exchange rates also tend to understate military spending. Military-PPP exchange rates give estimates of real spending that are 10% larger than GDP-PPP estimates in China, 20% larger in Russia, and 50–70% larger in Brazil, Columbia, Indonesia, Korea, and Ukraine. Thus GDP-PPP exchange rates provide a much better approximation than market exchange rates. They also tend to understate estimated real spending in countries with low wages and labour- (personnel-)intensive defence budgets.
Real defence spending versus military power
Whether the US is spending too much or not enough is a hotly debated issue and PPP concepts are sometimes invoked (e.g Korb 2021 and Greenwalt 2021). As tragically demonstrated by the collapse of the Afghan National Army, however, spending isn’t everything. Comparing real military spending across countries amounts to comparing military inputs, not military output. Military output, or ‘power’, also depends on a country’s defence strategy, alliances, force multipliers and other non-budget factors.
This, however, is true of all international comparisons of military spending, irrespective of what exchange rate concept is used. Using military-PPP does not remove the need for an expert eye to how effective a country’s spending is. It does, nevertheless, provide a more solid economic basis for thinking about these issues.
Caution is also required since the military-PPP values discussed here are based on very aggregate data and involve approximations. They can be improved upon, particularly with more disaggregated data. The key strength of the military-PPP approach is it sets out an exchange rate concept that has a clear economic meaning.
With these caveats, the results show that market exchange rates dramatically understate the real military spending of many countries including China, India, and Russia. Defence analysts will have their views on what this means in terms of relative capabilities. But evaluations of security risks can only be improved if they avoid exchange rate misperceptions.
*About the author:
- Peter Robertson, Professor of Economics, University of Western Australia; Dean, UWA Business Schoo
References
Beinart, P (2021), “Let’s cut our ridiculous defense budget”, New York Times, 7 April.
The Economist (2020), “Buck for the bang: Nominal spending figures understate China’s military might”, 1 May.
Frankel, J (2014), “China is not yet number one”, VoxEU.org, 9 May.
FederalPay.org (2021), “United States Army – O-6 colonel”, accessed 25 September.
Gilboy, G J, and E Heginbotham (2012), Chinese and Indian strategic behaviour: Growing power and alarm, New Delhi: Cambridge University Press.
Greenwalt, B (2021), “China already outspends US military? Discuss”, Breaking Defense, 26 May.
Korb, L (2021), “China is not outspending US on defense; ’22 budget is enough”, Breaking Defense, 7 June.
Peter G Peterson Foundation (2021), “The US spends more on defense than the next 11 countries combined”, 19 July.
Robertson, P E, and A Sin (2017), “Measuring hard power: China’s growth and military capacity”, Defence and Peace Economics 28(1): 91-111.
Robertson, P E (2015), “China’s military and growing political power”, VoxEU.org, 30 March.
Robertson, P E (2021), “The real military balance: International comparisons of defense spending”, Review of Income and Wealth (forthcoming).
The South China Morning Post (2021), “China to boost pay for PLA forces after years of sweeping reforms”, 21 January.
Stockholm International Peace Research Institute (2021), SIPRI military expenditure database, accessed June 2021.
Zakaria, F (2021), “The Pentagon is using China as an excuse for huge new budgets”, Washington Post, 18 March.
Endnotes
1 Fareed Zakaria, writing in March 2021, argued, “America’s ‘edge’ over China is more like a chasm … China spends around $250 billion on its military, a third as much as the United States” (Zakaria 2021). Similarly Peter Beinart criticised US President Biden’s 2022 Department of Defense budget, arguing that “China spends less than one-third as much on defense as the United States” (Beinart 2021).
2 As an example, a colonel in the US army earns a salary of $7,100 to $12,638 per month (FederalPay.org 2021). Converting this to renminbi at the market exchange rate gives enough renminbi to pay for two to four colonels in the People’s Liberation Army, given a monthly salary of RMB 20,000 as reported by The South China Morning Post (2021).
3 Robertson (2021) discusses the implication of various standard index number approaches including bilateral and multilateral indices. The method builds on previous work on China in Robertson (2015) and Robertson and Sin (2017).
4 Military spending is also an annual flow, whereas capabilities depend on past spending assets and experience.