Racial Segregation And Southern Lynching – Analysis
By VoxEU.org
Lynchings in the American South reached their peak in the 1890s, but their impact persists today. This column applies a new measure of segregation to data on the incidence of lynchings to confirm earlier findings that counties with larger black population shares were more likely to experience lynchings, but also that greater segregation of the black population increased lynching activity. These findings demonstrate that residential segregation matters in rural areas for both intergroup relations and the economic and social outcomes that depend on those relationships.
By Lisa Cook, Trevon Logan and John Parman*
A growing body of empirical evidence documents important impacts of ethnic diversity and ethnic conflict on both economic and social outcomes. In the US context, economists typically focus on the influence of ethnic diversity on urban economic outcomes, with mixed results. While some studies document economic benefits of diversity in urban areas (e.g. Ottaviano and Peri 2006), others find that increased diversity is associated with lower levels of social capital (Costa and Kahn, 2003), public goods provision (Alesina et al. 1999) and economic growth rates (Alesina and La Ferrara, 2005).
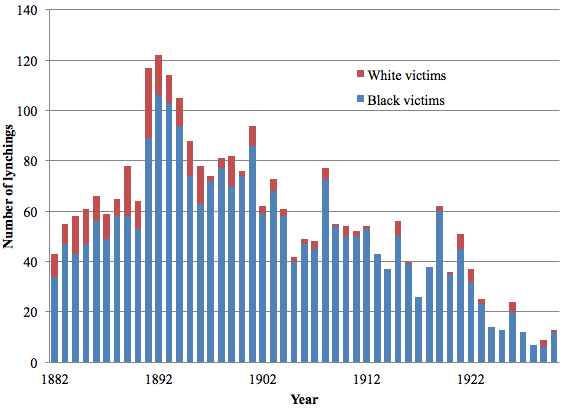
One limitation of this literature is a lack of historical depth. Ethnic and racial divisions are inherently historical processes which play out over time and which can have persistent effects, from altering paths of development to becoming cultural norms. Consider the long-run impacts of America’s dark history of interracial violence in the form of lynchings, which most often involved white mobs targeting black victims. Lynchings reached their peak in the 1890s, as seen in Figure 1, yet their impact persists to this day (Messner et al. 2005). One visible consequence of the long history of discrimination and interracial violence faced by black Americans is the modern gap in trust levels in the US, where black individuals are 24% less likely to trust others than non-black individuals (Alesina and La Ferrara 2002). These modern trust levels are lowest in those states that experienced the highest levels of lynchings in the early 20th century, with Mississippi, Alabama, and Arkansas among the states with the highest number of lynchings historically and the lowest levels of trust today. These same states also have some of the lowest average incomes and levels of public goods in the country today. Understanding the nature of lynchings and other forms historical intergroup conflict is crucial to understanding modern attitudes, institutions, politics, and economic performance.
Figure 1 Number of lynchings in the American South by year and race of victim

Investigating the causes and consequences of violent racial conflict in America’s past requires pushing the existing literature on ethnic diversity and conflict in two understudied directions.
- First, it requires shifting the focus to rural rather than strictly urban communities.
- Second, the spatial distribution of racial groups, rather than simply their population shares, must be emphasised.
Historically, racial violence in the form of lynchings was particularly concentrated in America’s rural communities. These are areas that continue to show complicated links between anti-minority attitudes, political attitudes, public goods provision, and intergroup conflict (e.g. Tope et al. 2015, Kimmel and Ferber 2000). Furthermore, these areas span both majority-white and majority-black communities in the past and present. Group population shares alone – the focus of much of the ethnic fractionalisation and conflict literature – fail to identify the spatial distributions of these populations. However, spatial distribution is fundamental to understanding intergroup conflict. How segregated a group is will determine the extent to which that group interacts with members of other groups, interactions that can serve to either lessen or inflame tensions between groups.
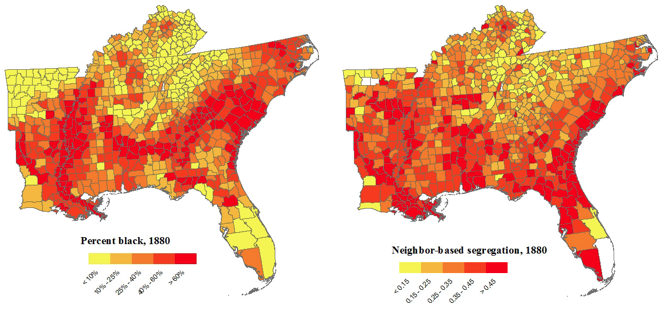
Recent work by two of us on the rise of residential segregation in the US provides a way to directly address the spatial distribution of groups in rural populations (Logan and Parman 2017). We construct a new segregation measure that exploits the availability of the complete (100%) manuscript pages for the federal census to identify the races of next-door neighbours. We measure segregation by comparing the number of household heads in an area living next to neighbours of a different race to the number expected under random assignment, i.e. the number expected under complete segregation and under no segregation. Being defined at the household level means that the measure can be constructed simultaneously for urban and rural areas, for the first time giving us a consistent measure of segregation. The importance of having a measure of segregation to complement the population shares by race used in the existing literature is demonstrated by Figure 2. This figure depicts both percent black for Southern counties in 1880 and neighbour-based segregation for those same counties. While some areas of the South such as counties along the Mississippi had both high black population shares and high levels of segregation, generally the spatial patterns of black population share and segregation are quite different.
Figure 2 The distribution of the black population in the American South, 1880 as shown by black population share (left) and neighbour-based segregation (right)

In a separate recent paper by all three authors, we match a county-level version of this new measure of segregation to the most comprehensive Southern lynching data available in order to assess how both the black population share and the segregation of that population were related to interracial violence (Cook et al. 2017). These lynchings span the years between 1892 and 1930 while our segregation data correspond to the year 1880. Thus, we are focusing on the impact of the pre-existing segregation of the black population on subsequent interracial violence, not on how the incidence of that violence drove changes in the residential location of black and white individuals.
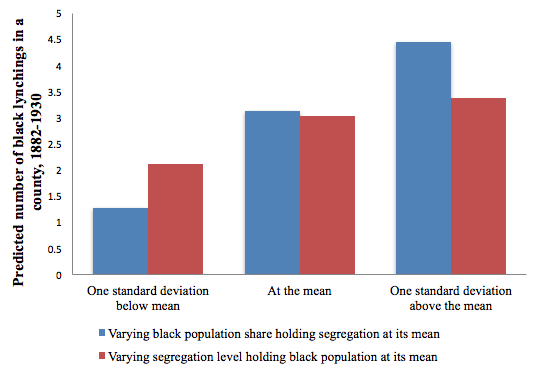
Consistent with prior work on Southern lynching, we find that counties with larger black population shares were more likely to experience lynchings, as shown in Figure 3. However, with these new segregation data we are also able to demonstrate that the segregation of that black population was also critical in predicting lynching activity. We find that segregation was strongly correlated with lynching: increasing segregation from one standard deviation below its mean to the mean is associated with a 43% increase in the predicted number of black lynching victims, from 2.1 to 3 (Figure 3). Counties that were more segregated were much more likely to experience a lynching. Conditional on having a lynching, more segregated counties were more likely to experience multiple lynchings.
These findings are not the product of more segregated counties being generally more prone to violence or vigilante justice; we find that segregation is strongly correlated with lynchings involving a black victim, but uncorrelated with lynchings involving a white victim. Residential segregation was strongly correlated with interracial violence but had little effect on intraracial violence. This asymmetry in negative outcomes associated with lynchings involving black victims and white victims is consistent with the finding in Cook (2014), that significant diminished patent activity was associated with the former but not the latter.
Figure 3 The predicted number of black lynchings experienced by a county between 1882 and 1930 when varying black population share and segregation

These results shed new light on the United States’ history of interracial conflict. They demonstrate that segregation is an important factor in interracial violence in rural communities, which is where three quarters of the population lived in the South in 1880. The most recent literature on lynching emphasises region-wide phenomena, and here we see that local variation in racial segregation plays a role in lynching. That rural social organisation, as measured by residential segregation, was related to conflict is a new finding which expands the scope of research on ethnic and racial fractionalisation and social conflict to rural areas. Furthermore, our finding that greater residential segregation was associated with more lynchings helps us begin to sort through potential mechanisms underlying interracial violence. In the case of the American South, residential segregation did not allow the black community to insulate itself from interracial violence, nor did it serve as a substitute for interracial violence. Instead, racial segregation appears to have inflamed interracial conflict. This is a critical new finding to help us understand more generally the ways that residential segregation and intergroup contact influence intergroup conflict.
This exploration of America’s history of interracial violence helps us better understand the deep roots of racial tensions in the US today. However, it also emphasises a more general point that residential segregation matters in rural areas for both intergroup relations and the economic and social outcomes that depend on those relationships. Rural residential segregation grew tremendously during the first half of the 20th century (Logan and Parman, 2017) and remains particularly high throughout the country today (Lichter et al., 2007). Given that racial and ethnic dynamics in rural areas play a large role in contemporary national politics, public-goods provision, and public policy, further study of how rural segregation continues to influence those dynamics is crucial.
*About the authors:
Lisa Cook, Associate Professor in the Department of Economics and in International Relations, Michigan State University
Trevon Logan, Hazel C. Youngberg Trustees Distinguished Professor in the Department of Economics, The Ohio State University
John Parman, Associate Professor in the Department of Economics, College of William & Mary; Faculty Affiliate of the Thomas Jefferson Program in Public Policy and the Schroeder Center for Health Policy
References:
Alesina, A, R Baqir, and W Easterly (1999), “Public goods and ethnic divisions”, The Quarterly Journal of Economics 114(4): 1243-1284.
Alesina, A, and E La Ferrara (2002), “Who trusts others?”, Journal of Public Economics 85(2): 207-234.
Alesina, A, and E La Ferrara (2005), “Preferences for redistribution in the land of opportunities”, Journal of Public Economics 89(5): 897-931.
Cook, L D (2014), “Violence and economic activity: evidence from African American patents, 1870–1940”, Journal of Economic Growth 19(2): 221-257.
Cook, L D, T D Logan, and J M Parman (2017), “Racial Segregation and Southern Lynching”, Working Paper No. w23813.
Costa, D L, and M E Kahn (2003). “Civic engagement and community heterogeneity: An economist’s perspective”, Perspectives on Politics 1(1): 103-111.
Kimmel, M, and A L Ferber (2000), “‘White Men Are This Nation:’ Right-Wing Militias and the Restoration of Rural American Masculinity”, Rural Sociology 65(4): 582–604.
Lichter, D T et al. (2007), “National estimates of racial segregation in rural and small-town America”, Demography 44(3): 563-581.
Logan, T D and J M Parman (2017), “The national rise in residential segregation”, The Journal of Economic History 77(1): 127-170.
Messner, S F, R D Baller, and M P Zevenbergen (2005), “The Legacy of Lynching and Southern Homicide”, American Sociological Review 70(4): 633–55.
Ottaviano, G I P, and G Peri (2006), “The economic value of cultural diversity: evidence from US cities”, Journal of Economic Geography 6(1): 9-44.
Tope, D, J T Pickett, and T Chiricos (2015), “Anti-Minority Attitudes and Tea Party Movement Membership”, Social Science Research 51: 322–37.

