
NASA Measures India’s Deadly Flooding Rains
During the past week extreme rainfall from two slow moving tropical low pressure areas caused severe flooding in southeastern India. One of the lows, designated System 97B continued to linger along the southeastern Indian coast on November 17. As System 97B and another low pressure area dropped heavy rainfall, NASA and partners around the world gathered data using an array of satellites.
The flooding has caused as many as 70 reported deaths. The city of Chennai in the state of Tamil Nadu were hit exceptionally hard, as 59 people were reported killed there.
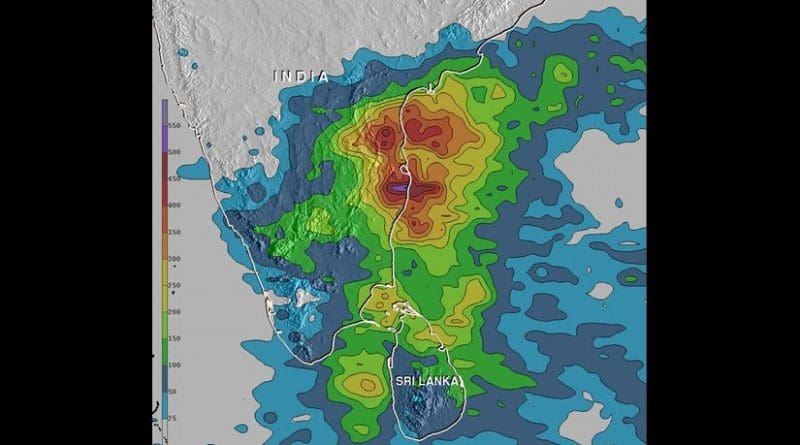
NASA’s Integrated Multi-satellite Retrievals for GPM (IMERG) combines all data from 12 satellites into a global map of rainfall at half hourly intervals. The rainfall accumulation analysis above was computed from data generated by IMERG during the past week from Nov. 9 to 16, 2015. An analysis of those data indicates that during the past week up to 550 mm (21.7 inches) of rain drenched India’s southeastern coast in the state of Tamil Nadu. Rainfall totals of over 200 mm (7.9 inches) were measured in large areas of southeastern India and northern Sri Lanka.
The Integrated Multi-satellitE Retrievals for GPM (IMERG) creates a merged precipitation product from the GPM constellation of satellites. These satellites include: DMSP (Defense Mapping Satellite Program) satellites from the U.S. Department of Defense, GCOM-W from the Japan Aerospace Exploration Agency (JAXA), Megha-Tropiques from the Centre National D’etudies Spatiales (CNES) and Indian Space Research Organization (ISRO), NOAA series from the National Oceanic and Atmospheric Administration (NOAA), Suomi-NPP from NOAA-NASA, and MetOps from the European Organisation for the Exploitation of Meteorological Satellites (EUMETSAT). All of the instruments (radiometers) onboard the constellation partners are inter-calibrated with information from the GPM Core Observatory’s GPM Microwave Imager (GMI) and Dual-frequency Precipitation Radar (DPR).
On Nov. 16 at 1800 UTC (1 p.m. EST) System 97B was located just 55 nautical miles east of Chennai, India. It was centered near 13.2 degrees north latitude and 81.1 degrees east longitude.
On Nov. 17 at 7:32 UTC (2:32 a.m. EST) the Visible Infrared Imaging Radiometer Suite (VIIRS) instrument aboard NASA-NOAA’s Suomi NPP satellite captured a visible image of System 97B. The storm stretched over southwestern Bay of Bengal near and the northern coast of Tamil Nadu and southern Andhra Pradesh coast. The VIIRS image showed bands of thunderstorms wrapping from the northern quadrant into the southwestern quadrant. The Joint Typhoon Warning Center noted that computer models show that System 97B is expected to move in a northerly direction. Maximum sustained winds are estimated between 20 and 25 knots (23 to 28.7 mph/37 to 46.3 kph), and System 97B has a minimum central pressure near 1004 millibars.
The low pressure area continued to generate heavy rain in Tamil Nadu and at isolated places over south coastal Andhra Pradesh.