
Natural Gas And Nuclear Power In EU: If You Can’t Beat Them, Green Them – Analysis
By Observer Research Foundation
By Lydia Powell, Akhilesh Sati and Vinod Kumar Tomar
Background
The European Union (EU) has proposed a new green taxonomy under which some natural gas and nuclear energy projects may be labelled as “green” investments if they meet specific criteria. A nuclear power plant is labelled green if the project has a plan, has secured funds, found a site to safely dispose of radioactive waste, and is in a position to receive construction permits before 2045. For natural gas, the criteria are that the plant has emission levels below 270 grams of carbon dioxide equivalent per kilowatt hour (gCO2eq/kWh), it replaces a more polluting fossil fuel plant, receives construction permit before 2030 and has a plan to switch to low-carbon gases by the end of 2035. This is part of the broader green taxonomy that the EU is developing. The first part of its taxonomy rulebook that included environmental criteria for investments in renewable energy (RE), shipping and car manufacturing is applicable from January 2022.
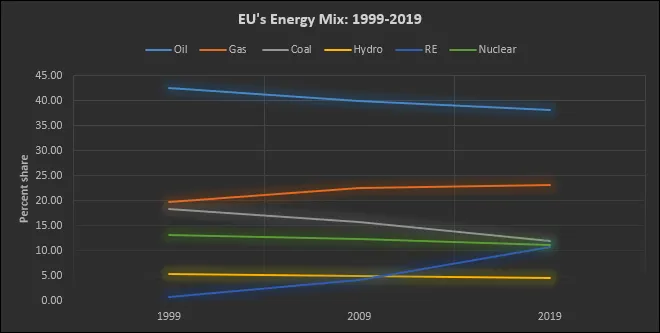
In the last two decades (1999-2019), primary energy consumption in the EU has fallen by over 4 percent from about 63 EJ to 60 EJ (exajoules). In the same period, the share of fossil fuels in the EU energy mix has fallen by about 13 percent from 51.46 EJ to 44.57 EJ. Most of the decrease in fossil fuel energy consumption was led by coal, which fell by over 37 percent in the same period. Natural gas consumption increased by over 11 percent and RE consumption increased by over 1,200 percent, although from a very small base.
In 2019, fossil fuels supplied roughly 73 percent of EU’s primary energy with oil accounting for about 38 percent, natural gas 23 percent and coal about 12 percent. Nuclear power accounted for over 11 percent of primary energy consumption, RE about 10 percent and hydro about 4 percent. Energy production in the EU in 2019 was dominated by RE that accounted for 37 percent of total production followed by nuclear energy that accounted for 32 percent, solid fossil fuels 19 percent, gas 8 percent and petroleum 4 percent. Imports accounted for roughly 60 percent of EU energy consumption and Russia was the largest source of oil, natural gas and coal imports. In 2000 fossil fuels accounted for 84 percent of energy consumption Germany. Since 2000, Germany developed 90 gigawatts (GW) of RE power generation capacity equal to its total power generation capacity. Yet in 2017, fossil fuels continued to supply 80 percent of energy consumption illustrating the energy transition challenge.
Energy Density
One of the key energy transition challenges is energy density of fuels, which is its ability to deliver substantial quantities of energy relative to its weight or physical dimensions. The energy density of natural gas at 40 million joules per cubic meter (J/m3) is only one thousandth of the energy density of oil but more than 10 trillion times that of solar energy. Higher the energy density of an energy source, lower is the transportation and storage costs. The energy density of nuclear power is more than 10 billion times that of oil which implies that the energy densities of solar and other RE sources is minuscule compared to that of nuclear energy. High energy and power densities of natural gas and nuclear power means that these sources of energy have lower surface or land requirement. With the shift towards RE, EU along with the rest of the world is climbing down the energy density ladder, from highly concentrated fossil fuels to more dispersed renewable sources which will require 100 or even 1,000 times more land area for energy production than today. For example, in 2010, modern RE sources (excluding hydropower) required almost 270,000 square kilometres (Km2) to deliver 130 GW, while the fossil fuel-nuclear-hydro system delivered 14.3 terawatt hours of power (more than 110 times that from RE) required about 230,000 Km2.
Carbon Emissions
A natural gas combined cycle plant can emit 403-513 gCO2eq/kWh from a lifecycle perspective and anywhere between 49-220 gCO2eq/kWh with carbon capture and storage (CCS) including methane emission from the extraction and transportation phases. In comparison solar technologies emit anywhere between 27-122gCO2/kWh for concentrated solar power (CSP) and 8-83 gCO2eq/kWh for photovoltaics (PV) with thin film PV technologies emitting less than silicon-based PV technologies. Carbon emissions from nuclear power are an order of magnitude lower than that of solar energy at 5.1-6.4 gCO2eq/kWh with the fuel chain contributing most of the emissions. Expanding RE addresses one global goal, that of reducing carbon emissions but not all global goals. In the EU, unintended macroeconomic consequences of rapidly scaling RE such as energy price inflation and the consequent impact on inequality are becoming significant.
Energy Price Inflation
Energy price in the EU increased to unprecedented levels in 2020. The European central bank (ECB) has acknowledged that part of the reason is the ongoing energy transition. According to the ECB, the combination of insufficient production capacity of RE in the short run, subdued investments in fossil fuels and rising carbon prices risk putting the EU through a protracted transition period during which the energy prices will continue to increase. The ECB expects the green energy transition to reinforce the supply demand imbalances arising from adverse weather conditions in 2021 that constrained the production of RE pushing gas prices to record high levels. In November 2021, wholesale electricity prices in the euro area reached €196/MWh, (Megawatt hour) nearly four times as much as the average in the two years before the pandemic. The ECB has stated that energy price inflation was the prime factor behind inflation that has touched the highest level since the euro was introduced in 1999. Though the tighter carbon pricing regime has led to reduction in emissions and increase in green innovation, these have come at the cost of higher energy expenditure for poorer households. On an annual basis, a doubling of wholesale electricity prices from about €50/MWh to €100/MWh would mean an additional €150 billion to be recovered from consumers. This will affect poor households much harder than wealthy ones. The share of people who have said that they could not afford to keep their home adequately warm is as high as 30 percent in some of the less wealthy EU countries. This is despite the fact that Eastern EU states with a lower contribution of RE has lower electricity prices than Western European states, with higher percentage of RE in total energy, had higher electricity prices. In addition studies on the EU economy have concluded that a 10 percent increase of the electricity price can lead to a 2 percent reduction of firm-level employment.
Implications
The new EU green taxonomy has angered many environmental groups as it appears to be a complete departure from the EU’s role as the leader of the ideological charge against both fossil fuels and nuclear energy. They are disappointed that the new taxonomy will compromise their cherished goal of 100 percent RE. They fear that investing in gas and nuclear will lock-in these technologies and slow down adoption of RE. This may be true but not if the EUs goal is decarbonisation through hydrogen in the longer term. Both natural gas and nuclear power can be used to generate hydrogen and the infrastructure built for natural gas can eventually be used to transport hydrogen.
For India, which has simultaneously embraced RE and hydrogen as the means to decarbonisation, EU’s experience will hold valuable lessons. More importantly, EU’s new green taxonomy may become the global regulatory standard for green investments which India could potentially adopt. Under the new taxonomy, investments in natural gas and nuclear projects in India may become more attractive as the cost of capital for these projects is likely to decline with decrease in perceived risk. There is also a lesson in EU’s embrace of natural gas and nuclear power. Its realist and technology agnostic approach to decarbonisation was probably unavoidable as the unintended economic, social, and political consequences of increasing the share of RE became harder to ignore. India must take note as it is less wealthy and more unequal than the EU.