Russia Energy Profile: Largest Producer Of Crude Oil – Analysis
By EIA
Russia is a major producer and exporter of oil and natural gas. Russia’s economic growth is driven by energy exports, given its high oil and natural gas production. Oil and natural gas revenues accounted for 43% of Russia’s federal budget revenues in 2015.1
Russia was the world’s largest producer of crude oil including lease condensate and the third-largest producer of petroleum and other liquids (after Saudi Arabia and the United States) in 2015, with average liquids production of 11.0 million barrels per day (b/d). Russia was the second-largest producer of dry natural gas in 2015 (second to the United States), producing 22.4 trillion cubic feet (Tcf), according to Russian Energy Ministry data.2
Russia and Europe are interdependent in terms of energy. Europe is dependent on Russia as a source of supply for both oil and natural gas, with almost 30% of European Union crude imports and more than 30% of natural gas imports coming from Russia in 2015. Russia is dependent on Europe as a market for its oil and natural gas and the revenues those exports generate. In 2015, almost 60% of Russia’s crude exports and more than 75% of Russia’s natural gas exports went to Europe.3
 Russia is the third-largest generator of nuclear power in the world and has the fifth-largest installed nuclear capacity. With seven nuclear reactors currently under construction, Russia is second to China, in terms of number of reactors under construction as of August 2016.4
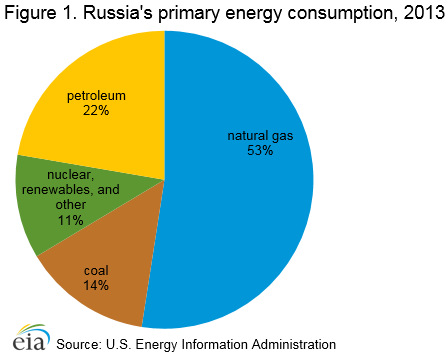
Russia consumed 30.52 quadrillion British thermal units (Btu) of energy in 2013, the majority of which was in the form of natural gas (53%). Petroleum and coal accounted for 22% and 14% of Russia’s consumption, respectively (Figure 1).
Effects of sanctions and lower oil prices
Sanctions and lower oil prices have reduced foreign investment in Russia’s upstream, especially in Arctic offshore and shale projects, and have made financing projects more difficult.
In response to the actions and policies of the government of Russia with respect to Ukraine, in 2014 the United States imposed a series of progressively tighter sanctions on Russia.5 Among other measures, the sanctions limited Russian firms’ access to U.S. capital markets, specifically targeting four Russian energy companies: Novatek, Rosneft,6 Gazprom Neft, and Transneft. Additionally, sanctions prohibited the export to Russia of goods, services, or technology in support of deepwater, Arctic offshore, or shale projects.7 The European Union imposed sanctions, although they differ in some respects.8
In recent years, the Russian government has offered special tax rates or tax holidays to encourage investment in difficult-to-develop resources, such as Arctic offshore and low-permeability reservoirs, including shale reservoirs. Attracted by the tax incentives and the potentially vast resources, many international companies entered into partnerships with Russian firms to explore Arctic and shale resources. ExxonMobil, Eni, Statoil, and China National Petroleum Company (CNPC) all partnered with Rosneft in 2012 and 2013 to explore Arctic fields.9 Despite sanctions announced in March 2014, Total agreed in May to explore shale resources in partnership with Lukoil. However, Total halted its involvement in September 2014, as additional sanctions were announced later in the year. ExxonMobil, Shell, BP, and Statoil also signed agreements with Russian companies to explore shale resources. Virtually all involvement in Artic offshore and shale projects by Western companies has ceased following the sanctions.
Arctic offshore and shale resources are unlikely to be developed without the help of Western oil companies. However, these sanctions will have little effect on Russian production in the short term as these resources were not expected to begin producing for 5 to 10 years at the earliest. The immediate effect of these sanctions has been to halt the large-scale investments that Western firms had planned to make in these resources.
At the same time as the United States and the European Union were applying sanctions, oil prices fell by more than half, from an average Brent crude oil price of $109/barrel (b) in the first half of 2014 to just $52/b in 2015 and to $40/b in the first half of 2016. Both the sanctions and the fall in oil prices have put pressure on the Russian economy in general and have made it more difficult for Russian energy firms to finance new projects, especially higher-cost projects such as deepwater, Arctic offshore, and shale projects.
With lower oil prices, Russian state revenues from oil and gas activities have declined dramatically, and the state’s budget deficit has grown. In response, the Russian government has implemented or proposed various measures to increase revenues. The Russian government has changed the minerals extraction tax and export taxes on hydrocarbons several times over the last couple of years. The most recent changes and proposals for upcoming changes all tend to raise the taxes paid by oil and gas companies.
In addition to taxes, the Russian government also collects dividends from oil and gas companies in which the state is a shareholder. In April 2016, the Russian government directed state-controlled companies to pay out a minimum of 50% of 2015 net income as dividends, nearly double the dividends companies would normally pay.10 Oil companies have objected to both the tax and dividend increases, arguing they divert money from capital investment programs. Based on similar arguments, Rosneft negotiated a lower dividend payout.
In January 2015, the Russian government announced its intention to sell some of its shares in several Russian companies, including Bashneft and Rosneft. Bashneft was one of Russia’s 10 largest oil producers. In October, the federal government sold its 50.08% controlling stake in Bashneft to Rosneft for $5.3 billion. The Russian government currently owns 69.5% of Russia’s largest oil producer, Rosneft. It intends to sell up to 19.5% of the company, retaining a controlling interest.
Oil
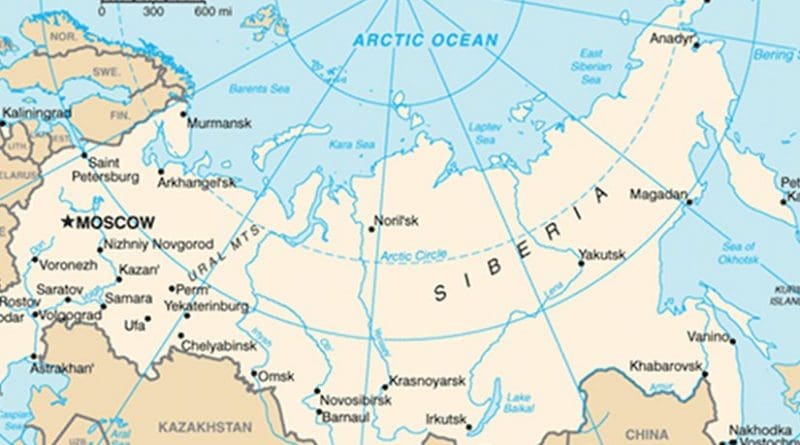
 Most of Russia’s oil production originates in West Siberia and the Urals-Volga regions. However, production from East Siberia, Russia’s Far East, and the Russian Arctic has been growing.
Russia’s proved oil reserves were 80 billion barrels as of January 2016, according to the Oil and Gas Journal.11 Most of Russia’s reserves are located in West Siberia, between the Ural Mountains and the Central Siberian Plateau, and in the Urals-Volga region, extending into the Caspian Sea.
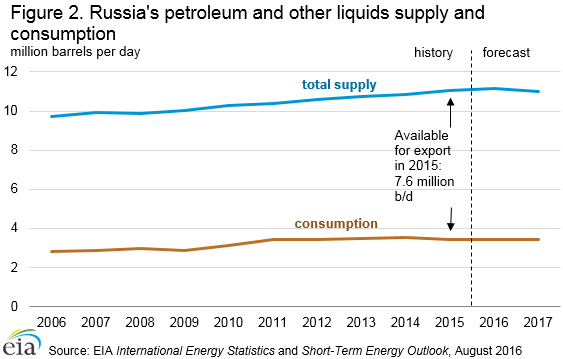
In 2015, Russia produced an estimated 11.03 million b/d of petroleum and other liquids (of which 10.25 million b/d was crude oil including lease condensate), and it consumed about 3.5 million b/d (Figure 2). Russia exported more than 7 million b/d in 2015, including roughly 5 million b/d of crude oil and the remainder in products and other liquids.
Exploration and production
Most of Russia’s oil production originates in West Siberia and the Urals-Volga regions (Table 1),12 with about 12% of production in 2014 originating in East Siberia and Russia’s Far East (Krasnoyarsk, Irkutsk, Yakutia, and Sakhalin). However, this share is up from less than 5% in 2009.13 In the longer term, Russia’s eastern oil fields, along with the largely untapped oil reserves in the Russian Arctic, may play a larger role. The Russian sector of the Caspian Sea and the predominantly undeveloped areas of Timan-Pechora in northern Russia also may hold large hydrocarbon reserves.
A number of new projects are in development. Some of these new projects may only offset declining output from aging fields and not result in significant output growth in the near term. The use of advanced technologies and the application of improved recovery techniques is resulting in increased oil output from some existing oil deposits. Fields in the West Siberian Basin produce the majority of Russia’s oil, with developments at Rosneft’s Samotlor field and Priobskoye area fields extracting more than 1.5 million b/d combined in 2015.14
| Region | Thousand b/d |
|---|---|
| Western Siberia | 6,326 |
| Urals-Volga | 2,297 |
| East Siberia and the Far East | 1,211 |
| Krasnoyarsk | 438 |
| Sakhalin | 335 |
| Irkutsk | 259 |
| Yakutia | 179 |
| Arkhangelsk | 309 |
| Komi Republic | 263 |
| North Caucasus | 60 |
| Kaliningrad | 26 |
| Total | 10,491 |
| Source: U.S. Energy Information Administration based on Eastern Bloc Research. | |
Russia’s oil- and natural gas-producing regions
West SiberiaWest Siberia is Russia’s main oil-producing region, accounting for about 6.3 million b/d of liquids production, more than 60% of Russia’s total production in 2014.15 One of the largest and oldest fields in West Siberia is Samotlor field, which has been producing oil since 1969. Samotlor field has been in decline since reaching a post-Soviet era peak of 635,000 b/d in 2006. However, with continued investment and application of standard enhanced oil recovery techniques, decline at the field has been kept to an average of 5% per year from 2008 to 2014,16 and to about 3% in 2015.17 These declines are significantly lower than the natural decline rate for mature West Siberian fields of 10—15% per year.18
Other large oil fields in the region include Priobskoye, Mamontovskoye, Malobalykskoye, and Prirazlomnoye. The newest of these fields is Prirazlomnoye, which was discovered in 1989, but only began production in 2014. The field lies in the Arctic offshore, and is being developed by Gazprom. Production from Prirazlomnoye field is expected to peak at about 100,000 b/d.19
The Bazhenov shale layer, which lies under existing resource deposits, also holds great potential. In the 1980s, the Soviet government tried to stimulate production by detonating small nuclear devices underground. In recent years, the government has used tax breaks to encourage Russian and international oil companies to explore the Bazhenov and other shale reservoirs. However, Russian firms have made little progress in developing shale resources because sanctions and low oil prices have hindered shale projects.
Urals-VolgaUrals-Volga was the largest producing region up until the late 1970s when it was surpassed by West Siberia. Today, this region is a distant-second producing region, accounting for about 22% of Russia’s total output. The giant Romashkinskoye field (discovered in 1948) is the largest in the region. Tatneft operates the field and produced about 300,000 b/d in 2013. 20
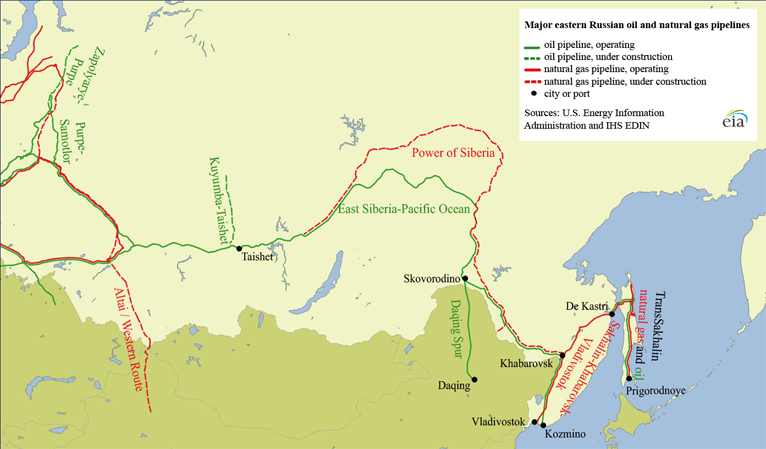
East SiberiaWith Russia’s traditional oil-producing regions in decline, East Siberian fields will be central to continued oil production expansion efforts. The region’s potential was increased with the inauguration of the Eastern Siberia-Pacific Ocean (ESPO) pipeline in December 2009, which created an outlet for East Siberian oil.
East Siberia has become the center of production growth for Rosneft, the state oil giant. The start-up of the Vankorskoye (Vankor) oil and natural gas field in August 2009 has notably increased production in the region and has been a significant contributor to Russia’s increase in oil production since 2010. Vankor, located north of the Arctic Circle in Russia’s Krasnoyarsk region, was the largest oil discovery in Russia in 25 years. In 2015, the field produced about 440,000 b/d. 21
There are a number of other fields in the region, including the Verkhnechonskoye oil and gas condensate field, the Yurubcheno-Tokhomskoye field, and the Agaleevskoye gas condensate field. 22
Yamal Peninsula/Arctic CircleThis region is located in the Yamal-Nenets Autonomous district, and it straddles West Siberia. This region is mostly known for natural gas production. Crude oil development is relatively new for the region. In the near term, the region is facing transportation infrastructure constraints, although the construction of the Purpe-Samotlor pipeline lessened some of these constraints. Transneft also is constructing the Zapolyarye-Purpe pipeline, connecting the Zapolyarye gas and condensate field to the Purpe-Samotlor pipeline.
In addition to the Zapolyarye natural gas and condensate field, the area is home to the Vostochno Messoyakha and Zapadno Messoyakha, Suzun, Tagul, and Russkoye oil fields, all of which will benefit from the additional transportation capacity. Gazprom’s Novoportovskoye field, on the Yamal peninsula, is not waiting for pipelines to bridge the considerable distance between it and existing infrastructure. In May 2016, Gazprom began loading production from the field at a new Arctic terminal for seaborne delivery to Europe. Production from Novoportovskoye field is expected to peak at about 125,000 b/d by 2018.23
North CaucasusThe North Caucasus region includes the mature onshore area as well as the promising offshore North Caspian area. Lukoil has been actively exploring some of the deposits situated in the North Caspian, and in 2010, Lukoil launched the Yurii Korchagin field, which produced about 30,000 b/d in 2014.24 By the end of 2016, Lukoil is scheduled to launch the Filanovsky field, which should reach production of 120,000 b/d in 2017. Other discoveries in the area include the Khvalynskoye and Rakushechnoye fields. The development of the region is highly sensitive to taxes and export duties, and any change or cancellation of tax breaks may negatively affect development.
Timan-Pechora and Barents SeaTiman-Pechora and the Barents Sea are located in northwestern Russia. Liquids fields in these areas are relatively small, however these areas have well-developed oil infrastructure. Two liquefied natural gas (LNG) projects have been proposed for the area, Gazprom’s Shtokman LNG and Rosneft’s Pechora LNG, both of which have the potential to yield significant quantities of hydrocarbon gas liquids (HGL). However, both projects have been delayed indefinitely.
Sakhalin IslandSakhalin Island is located off Russia’s eastern shore. The offshore area to the east of Sakhalin Island is home to a number of large oil and natural gas fields with significant investment by international companies. Many of Sakhalin’s oil and natural gas fields are being developed under two production-sharing agreements (PSA) signed in the mid-1990s. The Sakhalin-1 PSA is operated by ExxonMobil, which holds a 30% stake. Other members of the PSA include Rosneft (through two subsidiaries), Indian state-owned oil company ONGC Videsh, and a consortium of Japanese companies.25 The Sakhalin-1 PSA covers three oil and gas fields: Chayvo, Oduptu, and Arkutun-Dagi. Production started at Chayvo field in 2005, at Oduptu field in 2010, and at Arkutun-Dagi field in January 2015.26 Sakhalin-1 mainly produces crude oil and other liquids, most of which are exported via the De-Kastri oil terminal. Most of the natural gas currently produced at Sakhalin-1 is reinjected, with small volumes of gas sold domestically.
The Sakhalin-2 PSA covers two major fields—the Piltun-Astokhskoye oil field and the Lunskoye natural gas field—and it includes twin oil and gas pipelines that run from the north of the island to the south end of the island where the consortium has an oil export terminal and an LNG liquefaction and export terminal. The Sakhalin-2 consortium members include Gazprom which owns 50% plus one share, Shell with 27.5%, Mitsui with 12.5%, and Mitsubishi with 10%.27 When the PSA was originally signed, the consortium did not include any Russian companies and, compared with most PSAs, the terms were heavily weighted in favor of the interests of the consortium over the interests of the government. Sakhalin-2 produced its first oil in 1999 and its first LNG in 2009. The project incurred significant cost overruns and delays, and these issues were part of the justification the Russian government used to force Shell, which at the time owned a 55% interest in Sakhalin-2, and the other consortium members to sell a controlling interest in the consortium to Gazprom.28
Russia’s oil grades
Russia has several oil grades, including Russia’s main export grade, Urals blend. Urals blend is a mix of heavy sour crudes from the Urals-Volga region and light sweet crudes from West Siberia. The mixture and thus the quality can vary, but Urals blend is generally a medium (about 31°) gravity sour (about 1.4% sulfur content) crude oil blend and, as such, is generally priced at a discount to Brent crude. Siberian Light crude is a higher quality and thus more valuable when marketed on its own, but it can also be blended into Urals crude because of limited infrastructure to move it to market separately.29
Sokol grade is produced by the Sakhalin-1 project and is a light, sweet crude with an API gravity of 36.0° and 0.30% sulfur content.30 Sakhalin blend includes crude produced from the Piltun and Astokh fields under the Sakhalin-2 PSA as well as condensate produced from Gazprom’s Kirinskoye gas and condensate field under the Sakhalin-3 license.31 Sakhalin is a light (45.5°API), sweet (0.16% sulfur content) blend.32 Sakhalin blend is loaded at the Prigorodnoye port, on the southern tip of Sakhalin Island.
The Eastern Siberia-Pacific Ocean (ESPO) blend came on stream in late 2009 and is a mix of crudes produced in several Siberian fields. The grade is exported through the recently constructed ESPO Pipeline to China as well as through Russia’s Pacific coast port of Kozmino to other Asian countries. ESPO blend is a fairly sweet, medium-light blend, with a typical gravity of 35.6°API and 0.48% sulfur content.33
Gazprom Neft’s two Arctic fields, Prirazlomnoye launched in 2014 and Novoportovskoye launched in 2016, produce very different grades of oil. Arctic Oil (ARCO) grade from the Prirazlomnoye field is a medium-heavy (24° API), sour (2.3% sulfur content) crude,34 and Novy Port grade is a medium-light (30-35°API), sweet crude (0.1% sulfur content).35
Sector organization
Domestic companies dominate most of Russia’s oil production (Table 2).36 Following the collapse of the Soviet Union, Russia initially privatized its oil industry, but Russia’s oil and gas sector has gradually reverted to state control over the past few years.
Starting in the late 1990s, privately-owned companies drove growth in the sector, and a number of international oil companies attempted to enter the Russian market, with varying degrees of success. More recently, the Russian oil industry has consolidated into fewer firms with more state control. Five firms, including their shares of joint venture production, account for more than 75% of total Russian oil production, and the Russian state directly controls more than 50% of Russian oil production. Smaller firms have generally had higher production growth than larger firms, but smaller firms could be less resilient in the face of lower oil prices. 37
In 2003, BP invested in TNK, forming TNK-BP, a 50-50 joint venture and one of country’s major oil producers. However, in 2012 and 2013, the TNK-BP partnership was dissolved, and the state-controlled Rosneft acquired nearly all of TNK-BP’s assets. For its share in TNK-BP, BP received cash and an 18.5% share of Rosneft.38 In the previous decade, Rosneft emerged as Russia’s top oil producer following the liquidation of Yukos assets, which Rosneft acquired.
A number of ministries are involved in the oil sector. The Ministry of Natural Resources and Environment issues field licenses, monitors compliance with license agreements, and levies fines for violations of environmental regulations. The Ministry of Energy develops and implements general energy policy. The Ministry of Economic Development supervises tariffs, while the Finance Ministry is responsible for hydrocarbon taxes.39
Russia has two main hydrocarbon taxes: the minerals extraction tax (MET) and the export tax. The export tax varies for crude oil and for different products. In 2011, Russia changed product export taxes so that export tax rates on all products were lower than the crude oil export tax to encourage investment in refining capacity. In recent years, the government has also offered special MET rates or MET holidays for difficult-to-develop resources, such as Arctic offshore and low-permeability reservoirs, including shale reservoirs. Recent increases to the MET rate have increased the value of these previously agreed MET discounts for difficult resources.
On January 1, 2015, hydrocarbon tax rates changed again. Previously, the export tax was about twice as high as the MET. This tax maneuver raised the MET and lowered export taxes for 2015 and set out additional changes for 2016 and 2017 which would further raise the MET and lower export taxes. The increases in the MET were designed to roughly balance the decreases in the export taxes, so that they would be roughly revenue neutral, neither increasing nor decreasing overall taxes on the energy industry.40
On January 1, 2016, the MET increased in accordance with the previously enacted tax maneuver. However, in late 2015, the Russian government adopted a new law that postponed the corresponding decrease in export taxes. This law also substantially increased the MET on natural gas produced by Gazprom in 2016. Throughout 2016, there have been several proposals to raise taxes on the oil and gas industry again beginning January 1, 2017. Proposals have included extending the special tax on Gazprom for another year, further postponing planned decreases in export taxes, or lowering the threshold at which the MET is applied.
| Company | Thousand b/d |
|---|---|
| Rosneft | 4,041 |
| Lukoil | 1,724 |
| Surgutneftegaz | 1,223 |
| Gazprom (including Gazprom Neft) | 997 |
| Tatneft | 528 |
| Slavneft | 334 |
| Bashneft | 355 |
| Russneft | 313 |
| PSA operators | 287 |
| Novatek | 120 |
| Others | 567 |
| Total | 10,491 |
| Source: U.S. Energy Information Administration based on Eastern Bloc Research. | |
Refinery sector
Oil exports
In 2015, Russia had roughly 7.6 million b/d of petroleum and other liquids available for exports, including almost 5 million b/d of crude and condensate exports. The majority of Russian crude oil exports (70%) went to European countries, particularly Germany, the Netherlands, Belarus, and Poland (Figure 3).45 Revenues from crude oil and products exports in 2015 accounted for 46% of Russia’s total export revenues.46 Additionally, 43% of Russia’s federal budget revenue in 2015 came from oil and natural gas activities.47 While Russia is dependent on European consumption, Europe is similarly dependent on Russian oil supply, with almost 30% of European Union crude oil imports in 2015 coming from Russia.48
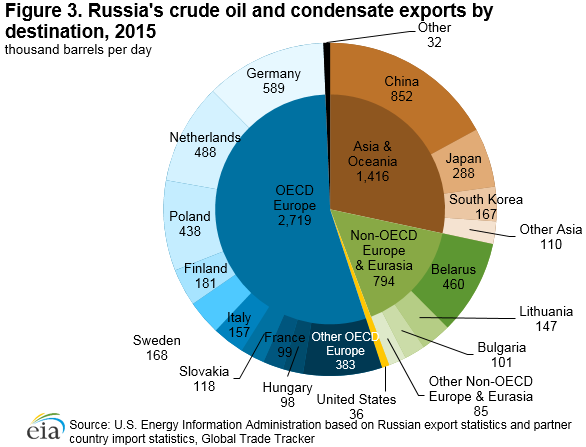 Asia and Oceania accounted for 28% of Russian crude exports in 2015, with China and Japan accounting for a growing share of total Russian exports.49 Part of the increase in Russian crude exports to China has been growing exports to independent teapot refiners in China. Russian ESPO crude does not have to travel as far as Middle East crude to reach Chinese ports. This allows Russian crude to be shipped in smaller volumes and with more flexible scheduling, which makes it more desirable to independent refiners. Russia’s crude oil exports to North America and South America have been largely displaced by increases in crude oil production in the United States, Canada, and, to a lesser extent, in Brazil, Colombia, and other countries in the Americas. Russia’s Transneft holds a near-monopoly over Russia’s pipeline network, and the vast majority of Russia’s crude oil exports must traverse Transneft’s system to reach bordering countries or to reach Russian ports for export. Smaller volumes of exports are shipped via rail and on vessels that load at independently-owned terminals.
Russia also exports fairly sizeable volumes of oil products. According to Eastern Bloc Research, Russia exported about 1.6 million b/d of fuel oil and an additional 960,000 b/d of diesel in 2014. It exported smaller volumes of gasoline (100,000 b/d) and liquefied petroleum gas (60,000 b/d) during the same year.50
Pipelines
Source: U.S. Energy Information Administration and IHS EDIN
Russia has an extensive domestic distribution and export pipeline network (Table 3).51 Russia’s domestic and export pipeline network is nearly completely owned and run by the state-owned Transneft. One notable exception is the Caspian Pipeline Consortium (CPC) pipeline, which runs from Tengiz field in Kazakhstan to the Russian Black Sea port of Novorossiysk. The CPC pipeline is owned by a consortium of companies, with the largest share (24%) owned by the Russian government, whose interests in the consortium are represented by Transneft. KazMunaiGaz (19%), the state-owned oil and natural gas company of Kazakhstan, and Chevron (15%) are the second- and third-largest shareholders in the consortium. Another exception is the TransSakhalin pipeline, owned by the Sakhalin-2 consortium, in eastern Russia (Figure 4).
Ports
At least 20 Russian ports serve as outlets for hydrocarbon exports to various markets, including Europe, the Americas, and Asia. The top four ports (Novorossiysk, Primorsk, Ust-Luga, and Kozmino) together accounted for about 85% of Russia’s seaborne crude oil exports in 2015.52
The Primorsk and Ust-Luga terminals are both located near St. Petersburg, Russia, on the Gulf of Finland. The Primorsk terminal opened in 2006 and has a loading capacity of about 1.3 million b/d.53 The Ust-Luga oil terminal opened in 2009 and has a loading capacity of more than 0.5 million b/d.54 Both Primorsk and Ust-Luga receive oil from the Baltic Pipeline System, which brings crude from fields in the Timan-Pechero, West Siberia, and Urals-Volga regions. Ust-Luga is also a major port for Russian coal and HGL exports.
Novorossiysk is Russia’s main oil terminal on the Black Sea coast. Its load capacity is more than 1 million b/d.55
Kozmino is located near the city of Vladivostok, in Russia’s far eastern Primorsky province, and is the terminus of the ESPO crude oil pipeline. The port opened in December 2009 with an initial capacity of 0.3 million b/d. Kozmino initially received crude oil by rail from Skovorodino until the second phase of the ESPO pipeline opened in 2012.56 In 2015, almost 0.6 million b/d of crude oil was exported through Kozmino port, slightly below the current capacity.57
Hydrocarbon gas liquids
Russian output of hydrocarbon gas liquids (HGL) is expected to grow over the coming years. HGL refers to both the natural gas liquids (paraffins or alkanes such as ethane, propane, and butanes) and olefins (alkenes) produced by natural gas processing plants, fractionators, crude oil refineries, and condensate splitters but excludes liquefied natural gas and aromatics. HGL are produced in association with both natural gas and petroleum products.
Changes in Russia’s export taxes have spurred investment in refining capacity to produce higher quantities of gasoline and lighter distillates, in lieu of the high share of heavier fuel oil and gasoil the country’s refiners previously exported. The increasing use of fluid catalytic cracking and hydrocracking units is expected to result in increased HGL production at refineries. A further boost to HGL supply will come from natural gas processing, as Russian natural gas producers develop richer natural gas resources and as more associated natural gas production (which is currently flared) is connected to gas processing plants.
With a surplus of liquefied petroleum gas (LPG)—a mixture of propane and butane—on the Russian market, major producers have targeted the export market along with the development of HGL-fed petrochemical capacity as outlets for their growing production. Traditionally, the main outlet for Russian LPG exports had been shipments to Europe by rail. In mid-2012, Russia’s first modern LPG export terminal came online in Taman on the Black Sea. With a design capacity of approximately 30,000 barrels per day (b/d) of pressurized cargo, the port handled, on average, just under 17,000 b/d in 2015,59 all brought in by rail. In mid-2013, Sibur, Russia’s largest LPG producer, shipped its first LPG cargo out of Ust-Luga, near St. Petersburg.60 In a first for Russia, the Sibur-operated terminal is also capable of handling both pressurized and refrigerated product, and it is currently undergoing a capacity expansion from nearly 50,000 b/d to about 75,000 b/d.61 The Ust-Luga terminal, like Taman, is capable of receiving LPG by rail. Additional volumes of LPG are produced on-site at the Novatek-operated Gas Condensate Fractionation and Transshipment Complex.62
In addition to direct exports, Russian companies are seeking to use domestically produced LPG in petrochemical manufacturing, which would capture more of the value and minimizing their export tariff exposure. In December 2014, Sibur commissioned its propane dehydrogenation (PDH) facility at the Tobolsk-Polymer complex in West Siberia,63 which is capable of producing 510,000 tons per year of polymer-grade propylene from an estimated 33,000 b/d of propane feedstock. The company is planning to further increase its liquids consumption at the Tobolsk site with a proposed 1.5 million ton per year ethylene cracker,64 which is expected to be in operation by 2021. The $9.5 billion plant’s feedstock is expected to consist primarily of propane and butane. Some ethane will also be used to produce ethylene, propylene, and butylene/butadiene that will then feed into the production of derivative products, including high- and low-density polyethylene and polypropylene.65 Rosneft is also planning a major petrochemical complex at Nakhodka, on Russia’s Pacific Coast, near the Kozmino oil terminal. The new complex will include a refinery and a petrochemical plant with 1.4 million tons per year of ethylene capacity. The petrochemical plant will primarily consume naphtha as a feedstock.66
Natural gas
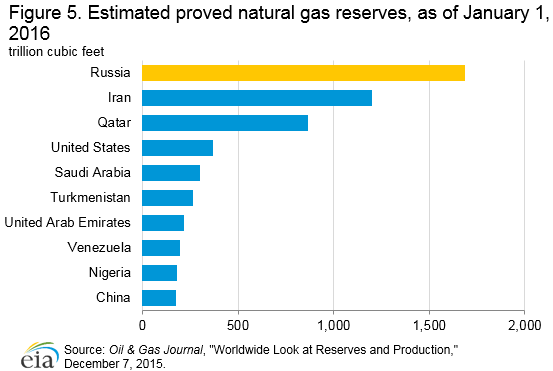 Russia holds the largest natural gas reserves in the world, and is the second-largest producer of dry natural gas. The state-run Gazprom dominates the country’s upstream natural gas sector, although production from other companies has been growing.
According to Oil and Gas Journal, Russia held the world’s largest natural gas reserves, with 1,688 trillion cubic feet (Tcf), as of January 1, 2016 (Figure 5).67 Russia’s reserves account for about one quarter of the world’s total proved reserves. The majority of these reserves are located in West Siberia, with the Yamburg, Urengoy, and Medvezhye fields accounting for a significant share of Russia’s total natural gas reserves.
Sector organization
The state-run Gazprom dominates Russia’s upstream natural gas sector, producing almost 70% of Russia’s total natural gas output in 2014 (Table 4).68 While independent and oil company producers have gained importance, upstream opportunities remain fairly limited for independent producers and other companies, including Russian oil majors. Furthermore, Gazprom’s dominant upstream position is reinforced by its legal monopoly on pipeline gas exports.
Much like the oil sector, a number of ministries and regulatory agencies are involved in the natural gas sector. The Ministry of Natural Resources and Environment issues field licenses, monitors compliance with license agreements, and levies fines for violations of environmental regulations. The Ministry of Energy develops and implements general energy policy and is also charged with overseeing LNG exports. The Finance Ministry is responsible for hydrocarbon extraction and export taxes, while the Ministry of Economic Development supervises tariffs.69
The main regulatory agencies involved in the natural gas sector include the Federal Tariff Service (regulates pipeline tariffs) and the Federal Anti-Monopoly Service (oversees charges of abuse of market dominance, including charges related to third-party access to pipelines).
| Company | Bcf/d |
|---|---|
| Gazprom | 42.9 |
| Novatek | 6.0 |
| Rosneft | 5.5 |
| Lukoil | 1.8 |
| Surgutneftegaz | 0.9 |
| PSA operators | 2.9 |
| Others | 1.9 |
| Total | 62.0 |
| Source: Eastern Bloc Research, CIS and East European Energy Databook 2015, Table 34, p. 14. | |
Exploration and production
 The bulk of the country’s natural gas reserves under development and production are in northern West Siberia (Table 5).70 However, Gazprom and others are increasingly investing in new regions, such as the Yamal Peninsula, Eastern Siberia, and Sakhalin Island, to bring gas deposits in these areas into production. Some of the most prolific fields in Siberia include Yamburg, Urengoy, and Medvezhye, all of which are licensed to Gazprom. These three fields have seen output declines in recent years.
In 2014, Russia was the world’s second-largest dry natural gas producer (20.4 Tcf), surpassed only by the United States (25.7 Tcf). Independent natural gas producers have been increasing their production rates, with non-Gazprom sources expected to continue to increase in the future. Higher production rates have resulted from a growing number of companies entering the sector, including oil companies looking to develop their gas reserves. Russian government efforts to decrease the widespread practice of natural gas flaring and to enforce gas utilization requirements for oil extraction may result in additional increases in production.
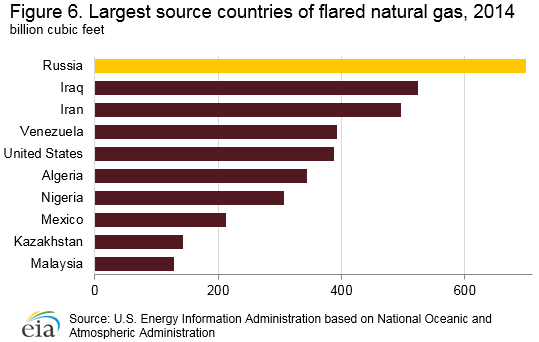
Gas flaringIn Russia, natural gas associated with oil production is often flared. According to the U.S. National Oceanic and Atmospheric Administration (NOAA), Russia flared an estimated 700 Bcf of natural gas in 2014, the most of any country. At this level, Russia accounted for about 13% of the total volume of gas flared globally in 2014 (Figure 6).72 A number of Russian government initiatives and policies have set targets to reduce routine flaring of associated gas. Also, regulatory changes have made it easier and more profitable for third-party producers to transport and market their natural gas. According to the NOAA estimates, from 2012 to 2014, flared natural gas in Russia declined on average by about 10% per year.
| Region | Bcf/d |
|---|---|
| West Siberia | 54.9 |
| Yamalo-Nenets | 50.9 |
| Khanti-Mansiisk | 3.5 |
| Tomsk | 0.5 |
| East Siberia and the Far East | 3.6 |
| Sakhalin | 2.4 |
| Irkutsk | 0.4 |
| Krasnoyarsk | 0.5 |
| Yakutia | 0.2 |
| Urals-Volga | 3.2 |
| Orenburg | 1.4 |
| Astrakhan | 1.1 |
| Others | 0.6 |
| Komi Republic | 0.3 |
| North Caucasus | 0.1 |
| Total | 62.0 |
| Source: U.S. Energy Information Administration based on Eastern Bloc Research | |
Natural gas exports
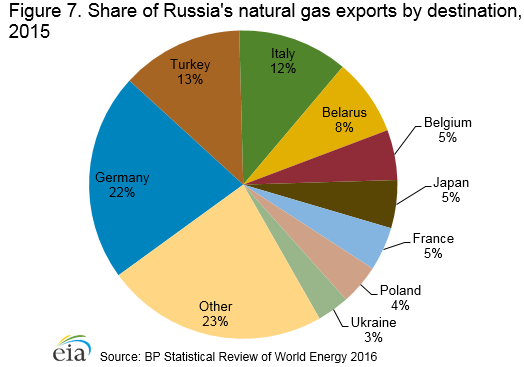 In 2015, almost 90% of Russia’s 7.3 Tcf of natural gas exports were delivered to customers in Europe via pipeline, with Germany, Turkey, Italy, and Belarus receiving the bulk of these volumes (Figure 7). Much of the remainder was delivered to Asia as LNG. Ukraine’s imports of Russian natural gas in 2015 were less than 30% of the level in 2013, when Ukraine was the third-largest importer of Russian natural gas. Because of a pricing and payments dispute and as part of the wider tensions between the two countries, Ukraine has decreased the natural gas it buys from Russia and increased the natural gas it buys from its western neighbors.
Revenues from natural gas exports in 2015 accounted for about 13% of Russia’s total export revenues.73 While not as large as Russia’s export earnings from crude oil and other liquids, Russia still has a significant level of dependence on Europe as a market for its natural gas. Europe, likewise, is dependent on Russia for its supply of natural gas. In 2015, the European Union received more than 30% of its natural gas imports from Russia.74 Additionally, some countries within Europe, especially Finland, the Baltics, and much of Southeast Europe, receive almost all of their natural gas from Russia.
Since the mid-2000s, natural gas consumption in OECD Europe75 has generally been flat to declining, prompting Russia to look to Asia and LNG as a means to diversify its natural gas exports. U.S. and European Union (EU) sanctions, implemented in 2014, accelerated Russia’s pivot to the east, with Russia signing two pipeline deals with China in 2014 covering exports that could eventually reach 2.4 Tcf per year.
Pipelines
In 2015, Russia’s natural gas transportation system included about 100,000 miles of high-pressure pipelines and more than 20 underground natural gas storage facilities.76 Since the late 2000s, Gazprom has been adding major new pipelines to accommodate new sources of supply, including fields in Yamal and Eastern Siberia, and new export routes, including exports to China and new pipelines to Europe that avoid Ukraine.
The Unified Gas Supply (UGS) system is the collective name for the interconnected western portion of Russia’s natural gas pipelines (Table 6).77 The UGS system includes domestic pipelines and the domestic portion of export pipelines in European Russia, but it does not include pipelines in eastern Russia. In 2007, the Russian government directed Gazprom to establish an Eastern Gas Program (EGP) to expand gas infrastructure in eastern Siberia and Russia’s Far East. The backbone of the EGP is the Power of Siberia pipeline, which is currently under construction.
Third-party access to pipelines
Gazprom is sole owner of virtually all of Russia’s natural gas pipelines. Russia’s 1999 Law on Gas Supply requires owners of all natural gas systems to provide non-discriminatory access to any available capacity with the aim of supplying domestic consumers. Separate regulations established rules for third-party access to the UGS system, but no rules have been established for access to pipelines that are not part of the UGS system. Access to pipeline capacity for exports is not included, as the 2006 Law on Gas Exports grants pipeline export rights exclusively to the owner of the UGS system, which is Gazprom.78
Despite these long-standing laws, independent natural gas producers, including state-owned oil companies, have only recently begun to get access to some of Gazprom’s domestic pipelines. Actions by the Federal Anti-Monopoly Service (FAS) have helped promote better third-party access. Between 2008 and 2011, the FAS brought 28 infringement cases against Gazprom related to third-party access.79 Third-party gas transported by Gazprom grew from 12% of UGS system inflows in 2010 to almost 21% in 2015.80 The FAS has also proposed new laws that would fix many of the deficiencies in the current laws and regulations, including the current lack of regulations for third-party access to pipelines that are not part of the UGS system. Many of the recent disputes over pipeline access have been related to eastern gas pipelines, which are not part of the UGS system.
To monetize its Sakhalin-1 natural gas resources, Rosneft has proposed to build a Far East LNG export facility at the southern end of Sakhalin Island. However, this proposal depends on Rosneft being able to send its gas through the Gazprom-controlled TransSakhalin natural gas pipeline. Gazprom has repeatedly denied Rosneft access to the pipeline on grounds that there is no available capacity, because Gazprom needs all the capacity to feed its existing Sakhalin-2 LNG plant and the LNG expansion it plans to build. Gazprom, incidentally, would like to buy gas from the Sakhalin-1 project to use as supply for its LNG expansion. Rosneft filed a court case to try to force Gazprom to give it pipeline access, and in 2015 Russia’s Supreme Court ruled in favor of Rosneft.
Liquefied natural gas
Russia has a single operating liquefied natural gas (LNG) export facility, Sakhalin LNG. This facility has been operating since 2009 with an original design capacity of 9.6 million tons (mt) of LNG per year (approximately 460 Bcf of natural gas). The majority of the LNG has been contracted to Japanese and South Korean buyers under long-term supply agreements. Debottlenecking and optimization of the facility added up to 3.2 mt (150 Bcf) of capacity in 2011,81 with much of the additional LNG sold under shorter-term agreements or on spot markets. In 2015, Sakhalin LNG exported slightly more than 500 Bcf of gas, which went to Japan (72%), South Korea (24%), Taiwan (2%), and China (2%).82
In 2013, Russia modified its Law on Gas Exports to allow Novatek and Rosneft to export LNG, breaking Gazprom’s monopoly on all gas exports. There are a number of proposals in various stages of planning for new LNG terminals in Russia, including a second LNG liquefaction facility that is under construction (Table 7).83 Yamal LNG, which began construction in 2013, is owned by a consortium, led by Novatek with a 50.1% interest. Total and CNPC each have 20% interest, and the Silk Road Fund (an investment fund established by the Chinese government) holds the remaining 9.9% interest in the project. The first of three liquefaction trains is scheduled to be online in 2017. The three trains will each have a capacity of 5.5 mt of LNG per year, and they will draw gas from the South Tambeyskoye natural gas and condensate field located in the northeast of the Yamal Peninsula.84
To transport LNG from its arctic location, Yamal LNG has commissioned the construction of up to 16 ice-class tankers. Exports are mainly aimed at Asian LNG markets, and during most of the year, the ice-class tankers will take cargoes west from the Yamal peninsula directly to Asia, transiting the Arctic Ocean and the Bering Strait. In winter, when the direct route is too ice-bound to be navigable, the ice-class tankers will take cargoes west from the Yamal peninsula to Europe. In Europe, the LNG will be loaded on to regular LNG tankers that will deliver the cargoes to Asia via the Suez Canal.
Electricity
Russia is one of the top producers and consumers of electric power in the world, with more than 230 gigawatts of installed generation capacity. In 2013, electric power generation totaled approximately 1,000 billion kilowatthours, and Russia consumed 878 billion kilowatthours.
Fossil fuels (oil, natural gas, and coal) are used to generate about two-thirds of Russia’s electricity, followed by hydropower (18%) and nuclear (16%). Most of the fossil fuel-fired generation comes from natural gas. Russia’s electric power generation totaled about 1,000 billion kilowatthours (BkWh) in 2013, and net electricity consumption was 878 BkWh. Russia exported approximately 18 BkWh of electricity in 2013 and imported almost 5 BkWh of electricity.
Sector organization
Much like the oil and natural gas sectors, a number of ministries and regulatory agencies are involved in the electric sector. The Ministry for Economic Development supervises tariffs and investment in the energy sector. The Ministry of Energy is in charge of general energy policy, including development of the legal framework for the electric sector. The Ministry of Energy also approves investment plans for Russia’s electric transmission system.
The main regulatory agencies involved in the sector include the Federal Tariff Service (regulates transmission tariffs) and the Federal Anti-Monopoly Service (oversees compliance with the unbundling rules and charges of abuse of market dominance in competitive electric markets). The state atomic energy corporation, Rosatom, controls all aspects of the nuclear sector in Russia, including uranium mining, fuel production, nuclear plant engineering and construction, generation of nuclear power, and nuclear plant decommissioning.85
Russia has seven separate regional power systems in the electric sector. These systems are: Northwest, Center, South, Middle Volga, Urals, Siberia, and Far East. The Far East system is fragmented with a weak connection to its neighbor to the west, the Siberian system. The Siberian system is also weakly connected with its neighbor to the west, the Urals system. The remaining five systems covering European Russia are well-integrated with one another and connected to systems in neighboring countries.86
The Russian electric sector was restructured in the past decade, and much of it was privatized. The reform required ownership unbundling in the electric sector, separating the industry into largely privately-owned, competitive generation assets and state-controlled, regulated transmission assets. No company is allowed to own both generation and transmission assets. The Federal Grid Company, which is more than 70% owned by the Russian government (directly and through Gazprom), controls most of the transmission and distribution infrastructure in Russia. The grid comprises more than 1.5 million miles of power lines, including slightly less than 100,000 miles of high-voltage cables of 220 kilovolts (Kv) or more. The government has been trying to attract private investment into the wholesale and regional electric generating companies. As part of the market reform, most of Russia’s fossil-fueled power generation was also privatized, while nuclear and hydropower remain under state control.87
Nuclear power
 Russia has an installed nuclear capacity of more than 27 million kilowatts, distributed across 36 operating nuclear reactors at 10 locations. Nine plants are located west of the Ural Mountains. The only exception is the Bilibino plant in the far northeast.88
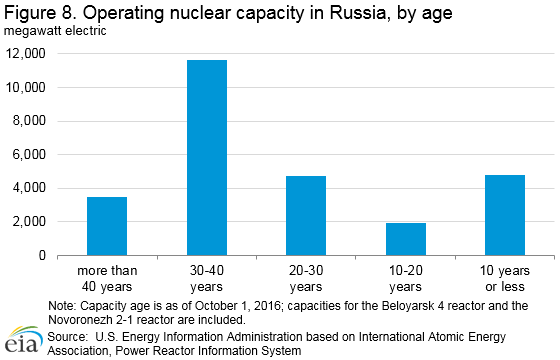
Russia’s nuclear power facilities are aging. The working life of a reactor is considered to be 30 years, but Russia has an active life-extension program. The period for extension is established by the government as 15 years, and 24 of Russia’s nuclear reactors, accounting for about 57% of the country’s operating nuclear capacity, are 30 or more years old (Figure 8).89 Eleven of the country’s 36 nuclear reactors use the high-power channel reactor (RBMK) design employed in Ukraine’s Chernobyl plant.90 Russia’s newest reactor, the 789 megawatt electric (MWe) Beloyarsk 4 reactor, was connected to the grid in December 2015, and it is expected to begin commercial operation in 2016.91
Russia’s current federal target program envisions a 45% to 50% nuclear power share of total generation by 2050 and a 70% to 80% share by 2100. To achieve these goals, the rapidly aging nuclear reactor fleet in Russia will need to be replaced with new nuclear power plants. As of October 1, 2016, seven new nuclear reactors were officially under construction across Russia, with 5,468 MWe net generating capacity (5,904 MWe gross). One of the plants under construction is a floating nuclear power plant, which is scheduled to begin operations by 2018.92
In addition to the seven nuclear reactors currently under construction, another 26 units are planned, with a total gross generating capacity of more than 28,000 MWe. These units are planned to be completed between 2018 and 2035.
Coal
 Russia has sizeable coal reserves and is the world’s third-largest exporter of coal.
With 177 billion short tons of coal at the end of 2014, Russia held the world’s second-largest recoverable coal reserves, behind the United States. Russia produced 394 million short tons in 2014, making it the sixth-largest coal producer in the world, behind China, the United States, India, Indonesia, and Australia. Almost 80% of Russia’s coal production was steam coal, and slightly more than 20% was coking coal.
In 2014, Russia consumed more than 60% of its coal production and exported the rest. Although coal accounts for a relatively modest share of Russia’s total energy consumption, coal is a more vital part of consumption in Siberia, where most Russian coal is mined.
More than half of Russia’s coal production comes from the Kuzbass basin in central Russia. Kuzbass coal must travel long distances by rail (about 2,600 miles) to reach Russia’s Baltic port of Ust-Luga, for export to European countries. The overland distance to Far East ports for export to Asian consumers is even greater.93 This long overland transport generally puts Russian coal at an economic disadvantage to competing sources of coal. Even so, in 2014, Russia was the third-largest coal exporting country in the world, exporting 171 million short tons, seaborne and overland. The top two coal exporters were Indonesia and Australia.
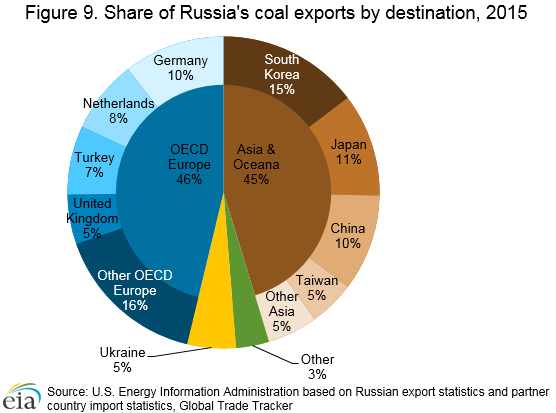
Russia’s coal exports have generally grown steadily since the late 1990s, with exports to Asia growing strongly in the past few years. In 2015, about 45% of Russia’s coal exports went to Asia (Figure 9).94 Russia’s total coal exports have approximately doubled over the past decade. Exports are expected to continue to grow in the future. In the short term, the weaker ruble, caused by sanctions and low oil prices, should make Russian coal exports more price-competitive in both Europe and Asia.
Russia’s coal-exporting ports are geographically located to serve either European or Asian markets. Some of Russia’s major coal ports include Murmansk, Ust-Luga, and Tuapse, all of which lie in the West and handle exports to Europe. Vanino and Vostochny lie in the East and handle exports to Asia.95 China and some East European countries receive imports from Russia directly by rail.96 Russia has plans to expand port capacity to facilitate more coal exports to Asia.
Notes:
- Data presented in the text are the most recent available as of October 25, 2016.
- Data are EIA estimates unless otherwise noted.
Endnotes:
1Ministry of Finance of the Russian Federation, Annual report on execution of the federal budget, (updated March 22, 2016).
2Soldatkin, Vladimir, ‘Russian oil output hits post-Soviet record high in December, 2015,” Reuters (January 2, 2016).
3EIA estimates based on Eurostat, International trade data and Russian export statistics and partner country import statistics, Global Trade Tracker (subscription).
4International Atomic Energy Association, Power Reactor Information Service, accessed September 16, 2016.
5The United States first announced limited sanctions in March 2014. Additional US sanctions, including broader economic sanctions, were announced over the course of the year, through September 2014. For additional details see U.S. Department of State, Ukraine and Russia Sanctions.
6“Announcement of Treasury Sanctions” http://www.treasury.gov/press-center/press-releases/Pages/jl2572.aspx, (accessed April 13, 2015).
7“Announcement of Expanded Treasury Sanctions” http://www.treasury.gov/press-center/press-releases/Pages/jl2629.aspx, (accessed April 13, 2015).
8The European Union (EU) first announced limited sanctions in March 2014, and first announced broader economic sanctions in July 2014. For additional details see European Union, EU sanctions against Russia over Ukraine crisis.
9Henderson, James and Julia Loe, “The Prospects and Challenges for Arctic Oil Development,” Oxford Institute for Energy Studies, (November 2014), p. 34.
10Gazprom Bank, “50% dividend payout threshold approved for state-controlled companies,” (April 20, 2016).
11Oil & Gas Journal, “Worldwide Look at Reserves and Production,” (December 7, 2015) p. 22.
12Eastern Bloc Research, CIS and East European Energy Databook 2015, Table 6 (2015), p. 2.
13Eastern Bloc Research, CIS and East European Energy Databook 2015, “Table 6 Production of oil+condensate by region, mn tons,” (2015), p. 2. Note, the Eastern Bloc Research figures include crude, condensate, and NGL.
14Based on production from Rosneft’s Samotlorneftegaz and Yuganskneftegaz subsidiaries, from Nefte Compass, “Russian Crude Oil And Gas Condensate Production/Exports, 2015,” (January 28, 2016), p. 12.
15Eastern Bloc Research, CIS and East European Energy Databook 2015, “Table 6 Production of oil+condensate by region, mn tons,” (2015), p. 2.
16Henderson, James, “Key Determinants for the Future of Russian Oil Production and Exports,” Oxford Institute for Energy Studies, (April 2015), pp. 4, 8.
17Based on production from Rosneft’s Samotlorneftegaz subsidiary, from Nefte Compass, “Russian Crude Oil And Gas Condensate Production/Exports, 2015,” (January 28, 2016), p. 12.
18Henderson, James, “Key Determinants for the Future of Russian Oil Production and Exports,” Oxford Institute for Energy Studies, (April 2015), pp. 4, 8.
19Gazprom Neft, Press Release, “Oil production at Gazprom Neft’s Prirazlomnoye field to increase almost two-fold,” (March 16, 2016).
20Tatneft, Oil and Gas Production, (accessed April 28, 2015).
21Rosneft, Press Release, “Rosneft Oil Company has successfully closed the transaction of selling 15% shares in Vankorneft JSC to ONGC Videsh Limited,” (May 31, 2016).
22Rosneft, Verkhnechonskneftegaz and East Siberian Oil and Gas Company, (accessed August 3, 2015).
23Gazprom, Press Release, “First cargo of Yamal oil shipped from Arctic Gate offshore terminal,” (May 25, 2016).
24Lukoil, Press Release, “Lukoil reaches landmark five million tonnes of oil at Yuri Korchagin Field in the Caspian Sea,” (August 11, 2015).
25Exxon Neftegas Limited, Consortium members, (accessed April 29, 2015).
26Exxon Neftegas Limited, Press Release “Sakhalin-1 Project Begins Production at Arkutun-Dagi Field,” (January 20, 2015).
27Shell, Sakhalin-2 —an overview, (accessed April 29, 2015).
28Krysiek, Timothy Fenton, “Agreements from Another Era: Production Sharing Agreements in Putin’s Russia, 2000-2007,” Oxford Institute for Energy Studies, (November 2007), pp. 19-26.
29Annenkova, Anna, “Russian Benchmarks of Black Gold,” Oil of Russia: Lukoil International Magazine, No. 4 (2012).
30ExxonMobil, Sokol, (accessed August 4, 2016).
31Nefte Compass, “Russia Exports New Crude Oil Grade,” (February 19, 2015), p. 3.
32Argus, Methodology and specifications guide: Argus crude, “Asia-Pacific, Sudan, ESPO Blend, Sakhalin Island assessments,” (July 2016), p. 23.
33Federal Customs Service of Russia and reporting countries’ import statistics, Global Trade Information Service (subscription).
34Gazprom Neft, Press Release, “Almost three million barrels of Arctic oil delivered to Northwest Europe,” (April, 17, 2015).
35Gazprom, Press Release, “First cargo of Yamal oil shipped from Arctic Gate offshore terminal,” (May 25, 2016).
36Eastern Bloc Research, CIS and East European Energy Databook 2015, Table 7 (2015), pp. 3—5. Note, the Eastern Bloc Research figures include crude, condensate, and NGL.
37Henderson, James, “Key Determinants for the Future of Russian Oil Production and Exports,” Oxford Institute for Energy Studies, (April 2015), pp. 4-7.
38BP, Working in Russia, (accessed August 4, 2016).
39International Energy Agency, Russia 2014: Energy Policies Beyond IEA Countries (June 2014), pp. 20-22 and 192-193.
40Henderson, James, “Key Determinants for the Future of Russian Oil Production and Exports,” Oxford Institute for Energy Studies, (April 2015), pp. 36-48.
41Oil & Gas Journal, “Worldwide Refining Survey,” (December 7, 2015) p. 2.
42Rosneft, Refining, (accessed August 5, 2016).
43Lukoil, Oil Refining, (accessed August 5, 2016).
44Henderson, James, “Key Determinants for the Future of Russian Oil Production and Exports,” Oxford Institute for Energy Studies, (April 2015), pp. 44-46.
45Russian export statistics and partner country import statistics, Global Trade Tracker, (subscription).
46EIA estimate based on data from UN Comtrade Database, (accessed August 10, 2016).
47Ministry of Finance of the Russian Federation, Annual report on execution of the federal budget, (updated March 22, 2016).
48European Commission, EU Crude Oil Imports and supply cost, Volumes and prices for monthly and cumulative crude oil imports by country of origin (2013-2015), (accessed August 10, 2016).
49Russian export statistics and partner country import statistics, Global Trade Tracker, (subscription).
50Eastern Bloc Research, CIS and East European Energy Databook 2015, Table 134 (2015), p. 41.
51Table 3: Transneft, Projects; Sakhalin Energy, TransSakhalin pipeline system; Caspian Pipeline Consortium, General information; State Oil Company of the Azerbaijan Republic (SOCAR), Baku—Novorossiysk oil pipeline; Orlen Lietuva, Terminal and pipelines; European Parliament, Gas and Oil Pipelines in Europe, “Pipelines from third countries,” (November 2009) p. 11; Nefte Compass, “Transneft Seeks to Offset Upstream Delays,” (April 16, 2015) p. 5; Rodova, Nadia, “Capacity crunch threatens Russia’s ESPO oil exports,” Platt’s Oilgram Price Report, (February 4, 2015) pp. 1, 34; and Argus FSU Energy, “Transneft stalls ESPO feeder line,” (January 28, 2016), p. 1.
52Lloyd’s List Intelligence (APEX tanker data).
53Lenmorniiproekt, Oil loading port Primorsk, (accessed August 5, 2016).
54Ust-Luga Oil, Terminal: Production Capacities, (accessed September 14, 2016).
55Kommersant, “New Terminal Project in the port of Novorossiysk…,” (accessed April 28, 2015).
56Transneft Kozmino Port, About the Company, (accessed April 28, 2015).
57Platt’s Oilgram Price Report, “Capacity crunch threatens Russia’s ESPO oil exports,” (February 5, 2015), p. 1.
58Tamanneftegas, Technical characteristics of the complex, (accessed September 15, 2016).
59PortNews, “Oil, LPG throughput at Tamanneftegas terminal jumped 35% in 2015 to 8.5 million tonnes,” (January 28, 2016).
60Sibur, “First gas carrier loaded at the new LPG transhipment terminal in Northwest Russia,” (June 19, 2013).
61Sibur, “RDIF, leading international co-investors and Sibur close deal for investment into marine terminal at Ust-Luga,” (November 3, 2015).
62PR Newswire, “NOVATEK Completes Construction Of The Second Stage Of Ust-luga Complex,” (October 16, 2013).
63Chemicals Technology News, “SIBUR commences propylene production using UOP technology at Russian plant,” (December 18, 2014).
64Sibur, “SIBUR proceeds with ZapSibNeftekhim project,” (September 16, 2014).
65Hydrocarbon Processing, “Winners: Top HPI projects of 2015,” (accessed August 16, 2016).
66Rosneft, “Rosneft and Mitsui & Co., Ltd Sign Memorandum of Understanding to Jointly Develop FEPCO Project,” (April 29, 2013).
67Oil & Gas Journal, “Worldwide Look at Reserves and Production,” (December 7, 2015), p. 22.
68Eastern Bloc Research, CIS and East European Energy Databook 2014, Table 34 (2014), p. 14.
69International Energy Agency, Russia 2014: Energy Policies Beyond IEA Countries (June 2014), pp. 20-22 and 192-193.
70Eastern Bloc Research, CIS and East European Energy Databook 2015, Table 33 (2015), p. 14.
71National Oceanic and Atmospheric Administration, Global Gas Flaring Observed from Space, Data Files Download. Note data includes flaring from downstream natural gas operations, downstream oil operations and upstream operations.
72BP Statistical Review of World Energy 2015, Data workbook, (accessed July 2, 2015).
73EIA estimate based on data from UN Comtrade Database, (accessed August 10, 2016).
74EIA estimate based on data from Eurostat, International Trade Data, (accessed August 10, 2016).
75OECD Europe (Organization for Economic Cooperation and Development) includes Austria, Belgium, Czech Republic, Denmark, Estonia, Finland, France, Germany, Greece, Hungary, Iceland, Ireland, Italy, Latvia, Luxembourg, Netherlands, Norway, Poland, Portugal, Slovakia, Slovenia, Spain, Sweden, Switzerland, Turkey, and United Kingdom
76Gazprom, Transmission and Underground Gas Storage Facilities, (accessed August 8, 2016).
77Table 6: Gazprom, Gas pipelines; GazpromExport, Transportation and Projects; Sakhalin Energy, TransSakhalin pipeline system; Nord Stream 2, The Pipeline; World Gas Intelligence, “Gazprom Braces for Yet More Pain,” (January 7, 2015), pp. 2-3; Nefte Compass, “Russia, Turkey to Speed Up Turk Stream,” (August 11, 2016), p. 3; and Argus FSU, “Gazprom revises PoS 1 plans,” (May 19, 2016), p. 11.
78Yafimava, Katja, “Evolution of gas pipeline regulation in Russia: Third party access, capacity allocation and transportation tariffs,” Oxford Institute for Energy Studies, (March 2015).
79Yafimava, Katja, “Evolution of gas pipeline regulation in Russia: Third party access, capacity allocation and transportation tariffs,” Oxford Institute for Energy Studies, (March 2015), pp. 16-17. Gazprom, Transmission, accessed August 8, 2016.
80Gazprom, Transmission, accessed August 8, 2016.
81World Gas Intelligence, “Russia’s New Asian Ambitions,” (March 30, 2011), pp. 1-2.
82BP Statistical Review of World Energy 2016, Data workbook, “Natural Gas: Trade movements 2015 as liquefied natural gas” (accessed June 8, 2016).
83Table 7: Gazprom, Sakhalin II; Total, Yamal LNG; Novatek, Yamal LNG; Gazprom, Baltic LNG; Gazprom, Vladivostok LNG; Gazprom, Kaliningrad Terminal; Pechora LNG, LNG Plant; Argus FSU, “Gazprom loses Baltic LNG funding,” (February 4, 2016) p 3; Reuters, “Novatek says some Arctic LNG-2 output would go to spot market,” (June 17, 2016); and World Gas Intelligence, “Sanctions, Prices Hit Russian LNG Plans,” (April 8, 2015), pp. 3-4.
84Yamal LNG, About the project, (accessed August 8, 2016).
85International Energy Agency, Russia 2014: Energy Policies Beyond IEA Countries (June 2014), pp. 20-22 and 192-193.
86Belobrov, Vladimir, Electricity Markets in Russia, accessed April 27, 2015.
87International Energy Agency, Russia 2014: Energy Policies Beyond IEA Countries (June 2014), pp. 183 and 198.
88World Nuclear Association, Nuclear Power in Russia, (accessed September 16, 2016).
89International Atomic Energy Association, Power Reactor Information Service, (accessed September 16, 2016).
90World Nuclear Association, RBMK Reactors, (accessed April 19, 2016).
91World Nuclear Association, Nuclear Power in Russia, (accessed September 16, 2016).
92World Nuclear Association, Nuclear Power in Russia, (accessed September 16, 2016).
93Suek, Our Assets, (accessed April 19, 2016).
94Russian export statistics and partner country import statistics, Global Trade Tracker, (subscription).
95Suek AG, Seaborne Deliveries, (accessed April 24, 2015).
96Suek AG, Railway Deliveries, (accessed April 24, 2015).

