
Jump In Inventories Leads To Stronger Than Expected US GDP Growth – Analysis
By Dean Baker
The economy grew at a 2.9 percent annual rate in the third quarter, the strongest growth rate since the third quarter of 2014. Most forecasts had put growth for the quarter at just over 2.0 percent. While the growth is better than expected, a big factor was an increase in inventory accumulation, which added 0.61 percentage points to growth. Accumulation was actually negative in the second quarter, so the rate of accumulation is likely to be even higher in the fourth quarter, again adding to growth. Final demand growth in the quarter was just 2.3 percent.
Most categories of final demand were relatively weak. Consumption grew at a modest 2.1 percent annual rate. Durable goods were the biggest gainer, growing at a 9.5 percent annual rate. Car sales grew at a 16.1 percent annual rate, adding 0.38 percentage points to the quarter’s growth. It is unlikely that sales will continue to grow at this pace, costing the economy an important source of strength. Consumption of services grew at just a 2.1 percent annual rate. Spending on health care services was especially restrained, with nominal spending growing at just a 4.0 percent annual rate in the quarter.
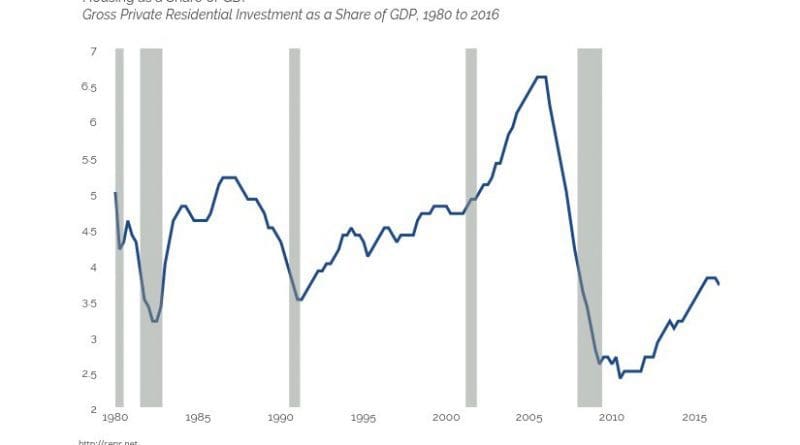
Residential investment fell at a 6.2 percent annual rate, its second consecutive decline. Residential investment now stands at 3.7 percent of GDP, close to its average for the decade prior to the housing bubble. While it may increase somewhat from this current level, the difference from the bubble peak of more than 6.5 percent and its current level creates a gap in aggregate demand of more than $500 billion. This is not easily filled.
Non-residential fixed investment grew at a 1.2 percent rate, roughly the same pace as in the second quarter. This follows two quarters of decline. Investment is now 1.2 percent below its year ago level, with non-residential structures down by 3.2 percent and equipment down by 4.5 percent, while investment in intellectual property products is up by 5.3 percent. The collapse of energy prices and the increase in the trade deficit in manufacturing are the major factors behind the weakness in this component.
Government expenditures increased at a 0.5 percent annual rate, with a 2.5 percent increase in federal spending offsetting a 0.7 percent decline at the state and local level. This is the second consecutive quarter of decline at the state and local level.
Exports were a source of strength in the quarter, rising at a 10.0 percent annual rate, the strongest performance since the fourth quarter of 2013. Imports grew at a modest 2.3 percent annual rate. As a result of the strong rise in exports, net exports added 0.83 percentage points to growth for the quarter. With the weakness in the economies of most major trading partners, and the strength of the dollar, it is unlikely that exports will continue to grow at this pace. At best, net exports will be a modest positive for growth in the next year.
One striking figure in this report is the slower pace of inflation shown in the core personal consumption expenditure deflator (PCE). This rose at just a 1.7 percent annual rate in the third quarter. The rate of inflation shown in the core PCE has been trailing off throughout the year, rising at a 2.1 percent annual pace in the first quarter and a 1.8 percent rate in the second quarter. While there are enough erratic movements in the quarterly data to avoid treating this as evidence of deceleration, it is certainly hard to make a case for acceleration with these data.
In this respect it is also worth noting that the Employment Cost Index for the third quarter showed a year over year rise of just 2.3 percent, the same as for the second quarter. Wage growth continues to outpace benefit growth in the private sector, with wages rising 2.4 percent, compared to 1.8 percent for benefits.
On the whole, this report indicates that the economy continues to grow at a modest pace. With the weak first half, it will take another quarter of 2.9 percent growth to just reach 2.0 percent for the full year. That is at or below most estimates of potential GDP. The price data also show zero evidence of accelerating inflation, indicating the economy is not reaching any limits.