
The Global Economy’s Turbulent Year In Five Charts – Analysis
Visualizations depict effects of war and inflation—and how they have changed as a new year beckons
It’s been a turbulent year. The global economy’s better-than-expected growth prospects early on quickly turned to concern after Russia’s invasion of Ukraine. Coupled with rapid and persistent inflation, particularly for food and energy, these headwinds weighed on growth and dimmed our forecasts.
Our Chart of the Week blogs have chronicled these inflection points. This week, we showcase five of our most popular charts that helped illustrate the effects of these developments. With updated data, the visuals also show how things have progressed since then.
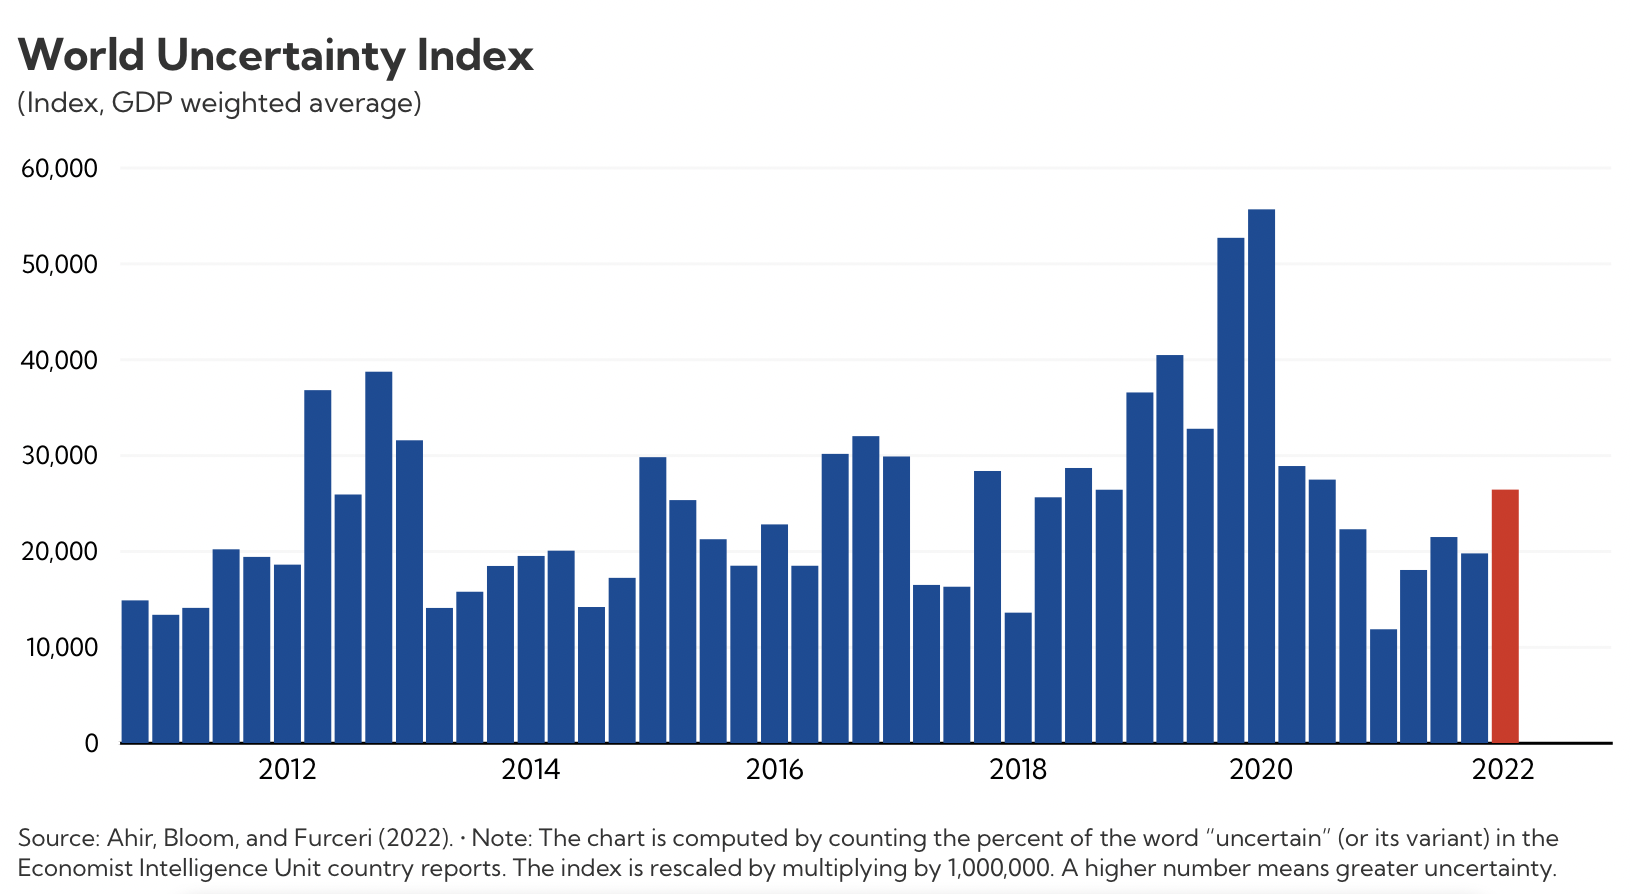
As the war in Ukraine unfolded, the World Uncertainty Index surged. A quarterly measure across 143 countries, our chart from April highlighted the broadening economic spillovers from the war.
The index has since moderated, but remains elevated.
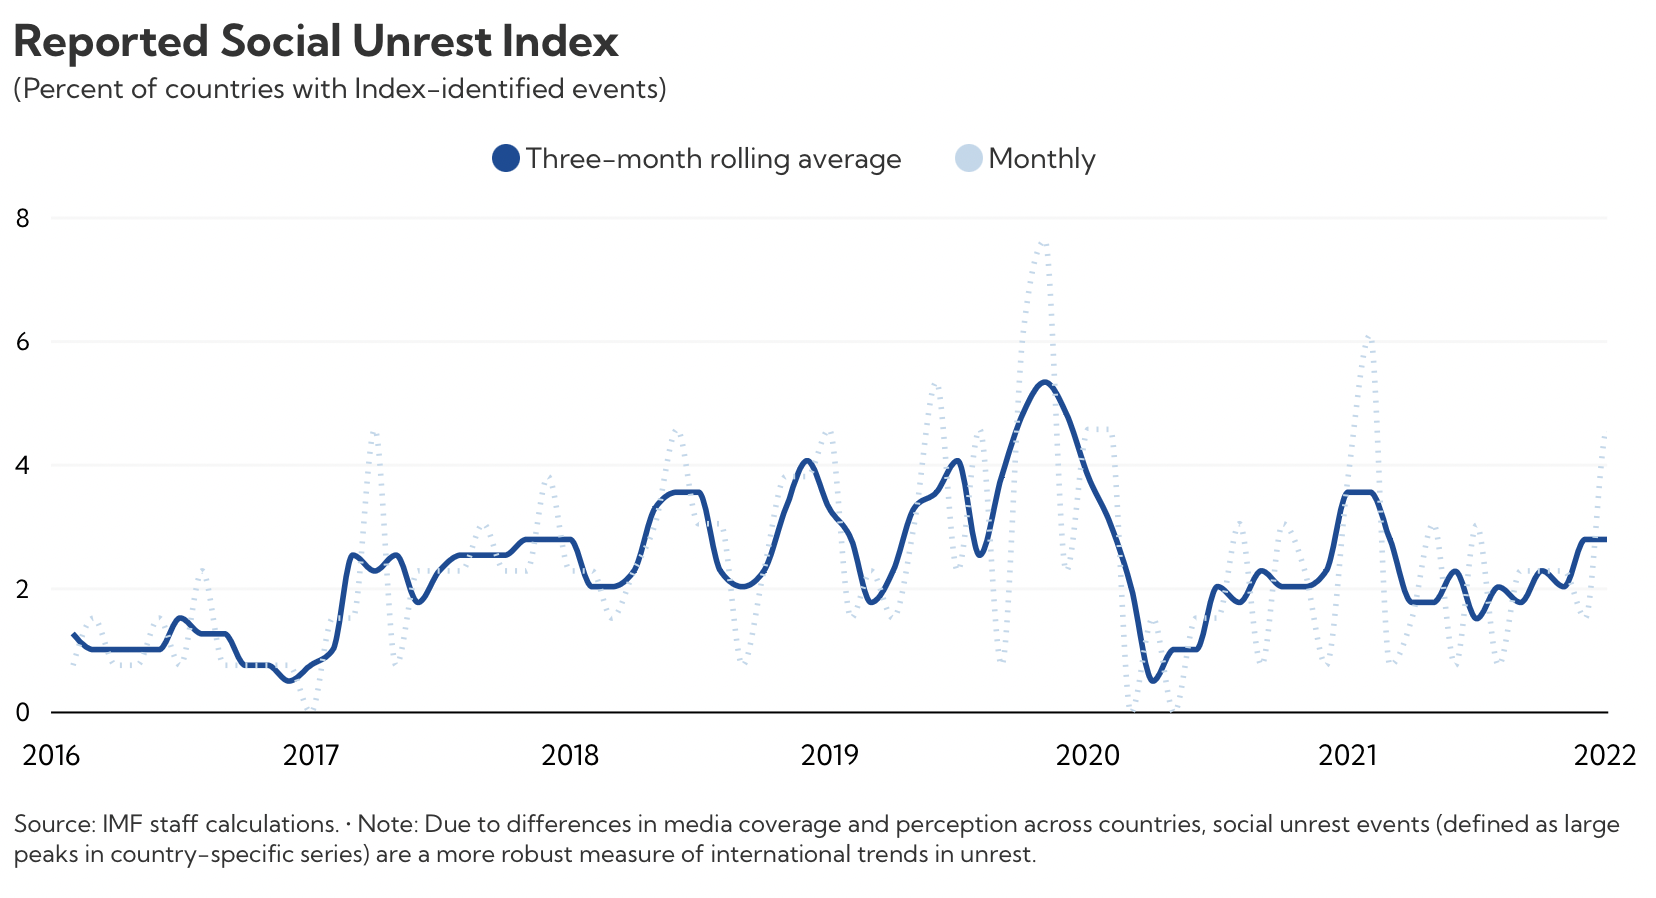
After a pause in popular protest during the first year of the pandemic, people returned to the streets. Our chart from May showed the rise in unrest and discussed its economic impact.
Despite several notable recent events, the index has since declined and remains below pre-pandemic levels.
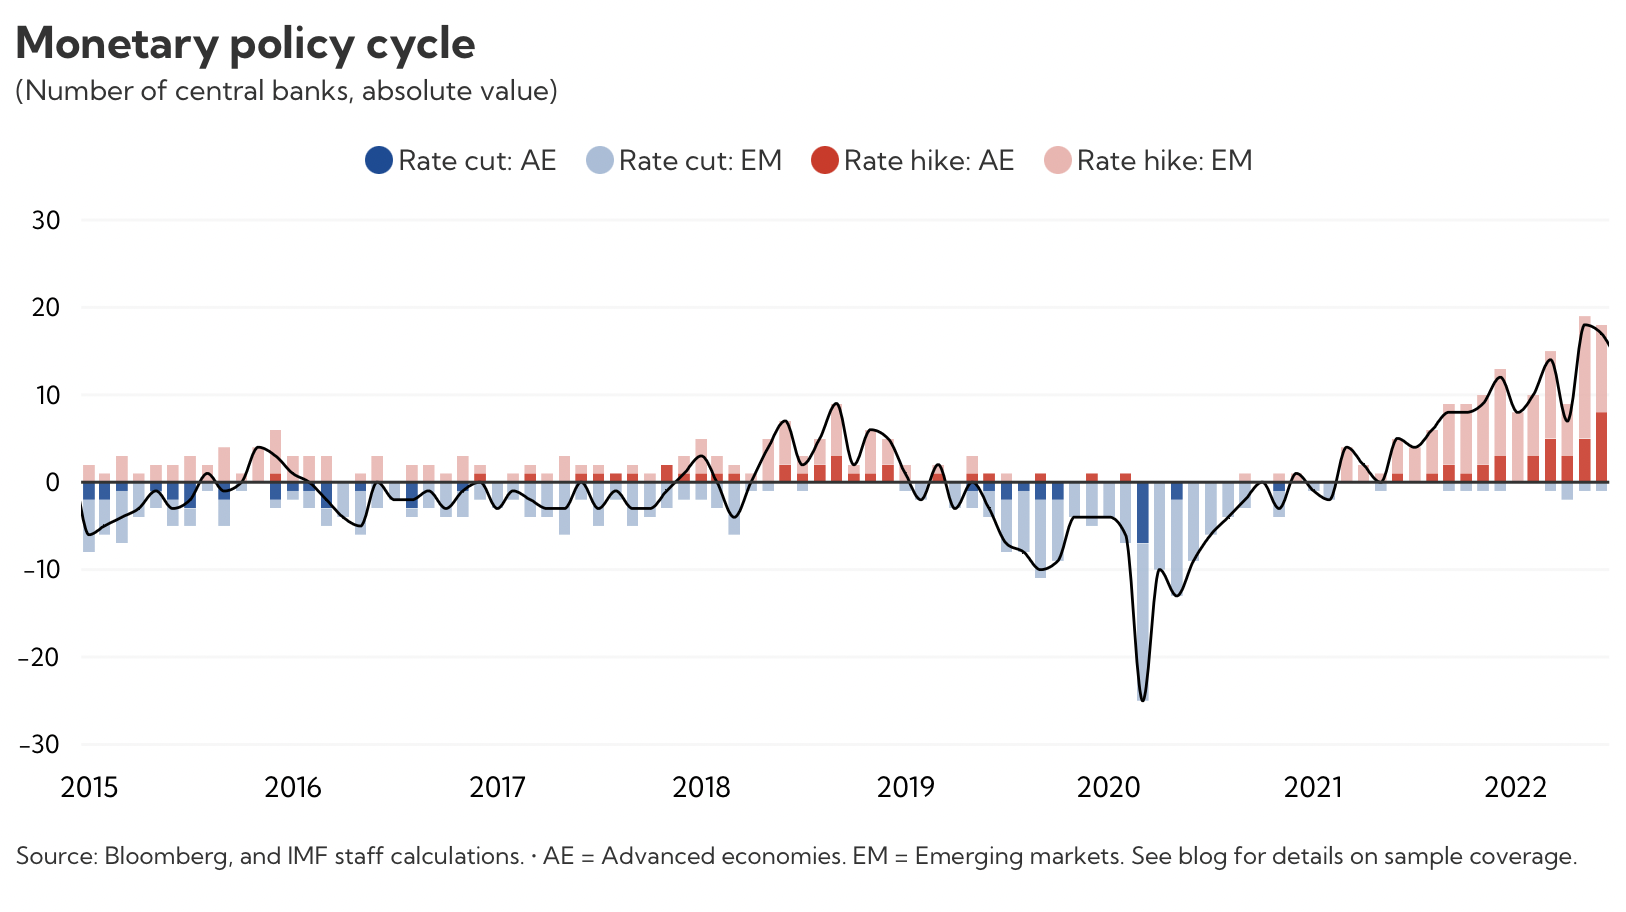
With inflation at multi-decade highs in many countries, central banks pivoted toward higher interest rates. Our chart from August showed the increasingly synchronized monetary policy cycle around the world.
As the year draws to a close, many central banks are still hiking rates.
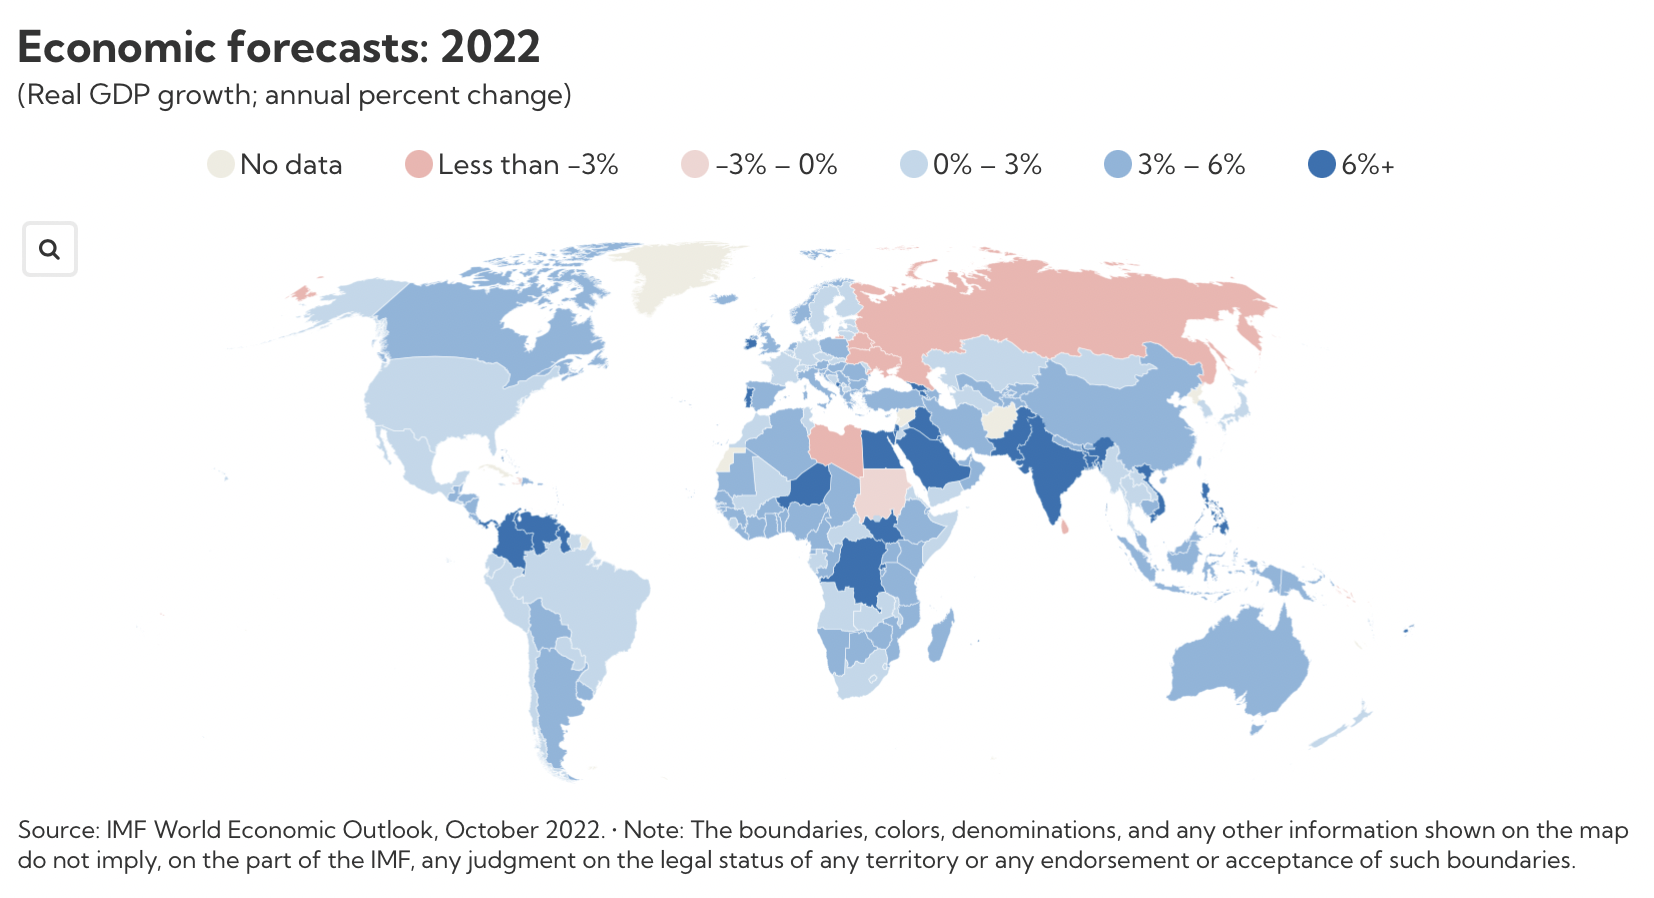
Amid historic challenges, our growth forecasts have decreased. The Chart of the Week pulled together all economic forecasts in October, showing the broad-based deceleration.
The next World Economic Outlook will provide updated projections in January.
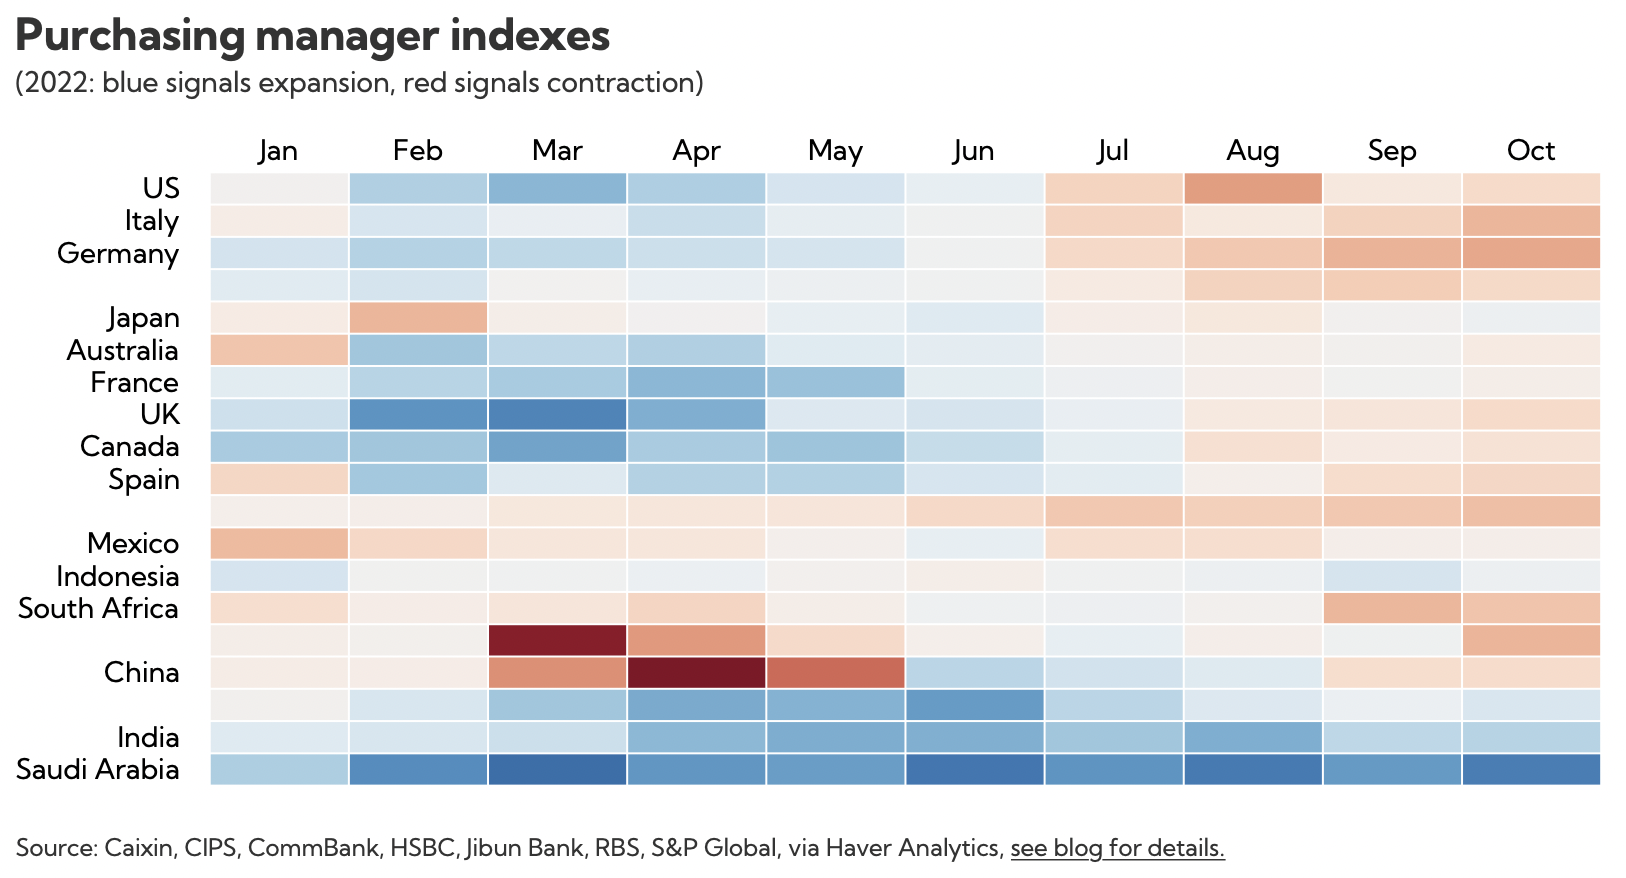
Another chart in November showed the steady worsening in survey-based measures that gauge the momentum of manufacturing and services activity for some of the world’s largest economies.
The latest data confirm that the downbeat trend generally remains intact at year-end.
About the author: Andrew Stanley is a communications officer in the IMF policy communications division. He overseas data visualization for various IMF content platforms. Before joining the Fund Andrew worked in various communications and research capacities in the energy sector, including in the Middle East, Washington DC, and London. He holds a master’s degree in international political economy from the Copenhagen Business School and a bachelor’s in business studies from Trinity College Dublin.
Source: This article was published by IMF Blog