Two Percent Or Not Two Percent? Interpreting ECB’s Definition Of Price Stability – Analysis
By VoxEU.org
Price stability is an explicit target for the ECB, but the definition of the 2% target is less clear in its monetary policy stance over time. This column presents two alternative interpretations of the ECB’s definition of price stability. First, the ECB dislikes inflation rates above 2% more than rates below 2%. Second, the ECB’s policy responses to past inflation gaps are symmetric around a target of 1.6% to 1.7%. Out-of-sample predictions of the reaction function based on the second interpretation track well an estimated shadow interest rate during the zero lower bound period.
By Maritta Paloviita, Markus Haavio, Pirkka Jalasjoki and Juha Kilponen*
In 1998, the ECB’s Governing Council defined price stability as “a year-on-year increase in the Harmonised Index of Consumer Prices (HICP) for the euro area of below 2%”. In 2003, the Governing Council clarified that “in the pursuit of price stability it aims to maintain inflation rates below, but close to, 2% over the medium term”. In a new paper, we shed light on this definition by estimating a large number of competing specifications of the ECB’s reaction function (Taylor 1993) (Paloviita et al. 2017). Our analysis makes use of quarterly Eurosystem/ECB staff macroeconomic projections of inflation and real GDP growth over the 1999Q4-2016Q4 period. Our results are largely based on reaction function specifications including a so-called monetary policy credibility loss term, which accounts for a possible credibility loss due to persistent deviations of inflation from the target.
Convergence of inflation projections
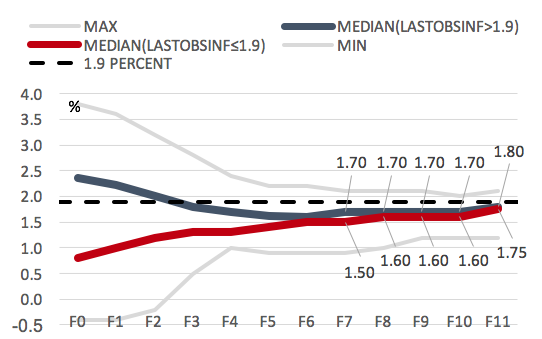
Eurosystem/ECB staff macroeconomic projections of inflation and GDP growth are important inputs presented to the ECB’s Governing Council when it assesses the general economic conditions and eventually decides on the monetary policy stance in the Eurozone. Figure 1 shows two separate medians and a min-max range of the inflation projections over our data sample. We have classified the inflation projections based on a simple criterion of whether the latest observed inflation rate during each projection exercise has been above or below 1.9%.
Figure 1 Median inflation projections conditioned on the latest observed inflation rate during each projection exercise
Sources: ECB and authors’ own calculations.
According to Figure 1, the median of projections made at times when the recent observed inflation rate is high (i.e. higher than 1.9%) converge to 1.7-1.8%, whereas the median of projections starting from lower inflation conditions (i.e. 1.9% or lower) converge to slightly lower rates around 1.6-1.75%. Lower medians converge to their eventual rates in a linear fashion, while the higher medians have a somewhat different shape – the median projections after one year are slightly below the medians at the end of the forecast horizon, i.e. inflation is projected to temporarily undershoot when inflation has been initially above 1.9%. Regardless of the current level of inflation, after about six quarters the median inflation projections are already in the proximity of their levels at the end of the forecast horizon. When compared to the actual realised inflation, the projected inflation exhibits clearly stronger and faster mean reversion. The same pattern applies to the GDP growth projections as well.
Monetary policy credibility loss
In addition to the real-time projections of inflation and GDP growth used in the estimation of the ECB reaction function, we consider a possibility that the ECB reacts to past deviations of inflation from the target. Following Neuenkirch and Tillmann (2014), we calculate the credibility loss term as the average of past deviations of inflation from the target.1 A positive (negative) credibility loss term indicates that past inflation has been above (below) the inflation target on average during a specified time period. This nonlinear term penalises large deviations of inflation from the target more than small ones. The general idea is that when inflation has been close to the target, the degree of credibility is high and the central bank just needs to keep the inflation rate stable in order to maintain credibility. Instead, when the central bank has missed the target in the past, it has to convince the public that it remains committed and it will gear inflation back to the target. Otherwise, there is an increasing risk of de-anchoring inflation expectations (e.g. Lyziak and Paloviita 2017).
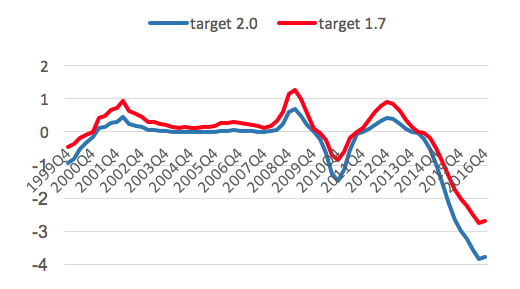
Figure 2 presents the values of the credibility loss term for the inflation targets of 1.7% and 2.0% using seven lags over which the average past inflation is measured. The past deviations of inflation from the target have been pronounced around 2002, 2009, 2011, and 2013, and again after 2014 when the nominal interest rate hit the lower bound and inflation slowed down persistently. Especially the relatively large (and persistent) inflation gaps in the post-2009 period may have had a significant impact on the monetary policy of the ECB. Augmenting the reaction function with the credibility loss term allows us to test whether this is the case.
Figure 2 Values of the credibility loss term
Sources: ECB and authors’ own calculations.
In our estimations, we allow this credibility term to enter into the reaction function either symmetrically or asymmetrically. In particular, we allow for a possibility that the ECB dislikes past positive inflation deviations from the target more than negative ones. We also augment the reaction function with a long run ex-ante or ex-post real interest rate, as a proxy for the natural real interest rate.
What does below, but close to, 2% mean?
Our idea is to analyse how the ECB conditions its policy decisions both on the future outlook of inflation and growth, and on the deviations of past inflation from the inflation target. It may set a higher (lower) interest rate today if the inflation gap has been positive (negative) in the past, even if inflation is expected to be at the target in the future. Our dependent variable is the EONIA interest rate and we allow for interest rate smoothing. After experimenting various projection horizons for inflation and real GDP growth, as well as alternative lengths of the time span over which the credibility loss term is measured, we choose to focus on reaction function specifications based on one-quarter-ahead real GDP growth and four-quarter-ahead inflation projections. As for the credibility loss, the time span of close to two years produces the most satisfactory results.
Using the chosen forecast horizons and lags in the credibility loss term, we then attempt to quantify the gist of the expression “below, but close to, 2%”, by allowing a point inflation target to vary at 1.6-2.% in the estimated reaction function. As mentioned above, we also allow for asymmetric policy responses to positive and negative deviations of inflation from the targeted level.
In-sample predictions
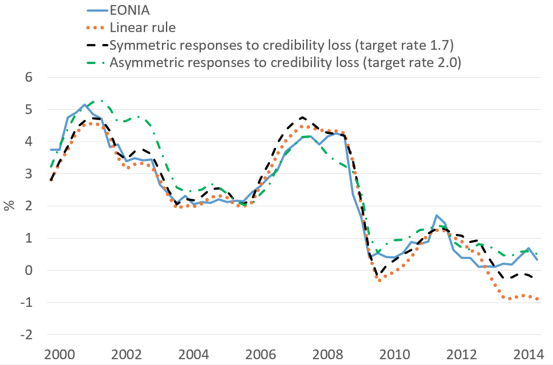
In-sample predictions of alternative reaction function specifications are shown in Figure 3 for the estimation sample 1999Q4-2014Q2. The in-sample predictions of the asymmetric reaction function deviate at times significantly from the EONIA rate and predictions of the two other specifications (linear and symmetric with a low de facto target). This is especially the case at the beginning of the sample, when Eurozone inflation was quite high. During 2005-2007, in turn, the asymmetric reaction function tracks relatively well the EONIA rate. In mid-2008, it misses the increase in the EONIA rate, and from there on it stays most of the time above the EONIA and also above the predictions of the two other reaction function specifications. At the same time, both the symmetric rule with a target inflation rate of 1.7% and the linear reaction function would have implied a stronger interest rate hike prior to the financial crisis, but in general more lax policy after 2009.
The linear reaction function, which only responds to projected inflation and real GDP growth and not at all to past inflation gaps, generates the lowest interest rate path at the end of the sample. The symmetric reaction function with a low de facto target inflation generates a similar path, but on a higher level, because the reaction function puts weight on a past positive inflation gap (see Figure 2) and less weight on a projected slowdown of inflation. Excluding the end of the sample, the symmetric and linear reaction functions give rather similar predictions for the interest rate path until about 2012. Furthermore, according to the symmetric and linear reaction functions, the zero-lower bound would have been reached much earlier, already in 2009, while according to the asymmetric reaction function it would not have been reached at all.
Figure 3. Dynamic in-sample predictions of different reaction function specifications
Sources: ECB, Thomson Reuters, and authors’ own calculations.
In summary, in-sample predictions based on both the asymmetric rule and the symmetric rule with a low de facto inflation target seem to give a fairly good description of the interest rate setting until mid-2014.
Out-of-sample predictions and comparison to a shadow rate
In order to analyse the most recent period when the standard interest rate policy has approached its effective lower bound, we evaluate the performance of our estimated reaction functions by comparing their out-of-sample predictions to a shadow interest rate estimated by Kortela (2016). A shadow rate is a summary measure of monetary policy stance, capturing unconventional as well as conventional policy measures. It can be used to show how much a central bank would have lowered the interest rates had the zero-lower bound not been binding its behaviour, i.e. it provides a mapping between a standard policy interest rate and, say, large scale asset purchases.
We use our estimated ECB reaction functions as shown in Figure 3 to produce out-of-sample forecasts for the time period 2014Q3-2016Q4. In this exercise, we predict the interest rate path using the estimated reaction functions given the projected inflation and GDP growth and the proxy for the natural real rate of interest.
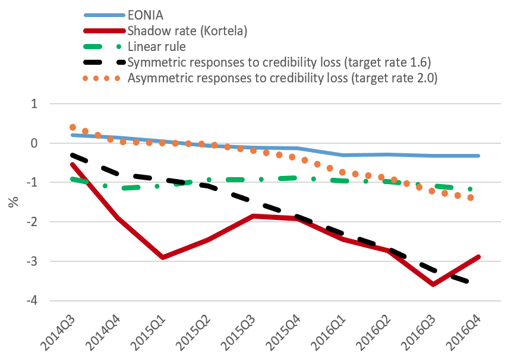
In Figure 4, the interest rate implied by the baseline linear rule remains negative and stable around -1% throughout the whole period – it is roughly 1% below the EONIA rate, but considerably higher than the shadow rate for most of the period.
The reaction functions taking account of a credibility loss imply falling interest rates over the period 2014Q3-2016Q4. We find that the symmetric reaction function with a low de facto inflation target of 1.7% tracks the shadow rate considerably better than the asymmetric reaction function with an inflation target of 2%. This suggests, tentatively, that the ECB’s definition of price stability is best characterised by an inflation target that is markedly below 2%, but the ECB is symmetric in its reactions to past inflation gaps. If we consider the symmetric reaction function based on a lower inflation target of 1.6%, which is also a plausible target rate according to our estimation results, the implied predictions are even more close to the shadow rate (see Figure 4).
Figure 4 Shadow rate and predictions based on different reaction functions
4a. Our preferred specification of the symmetric reaction function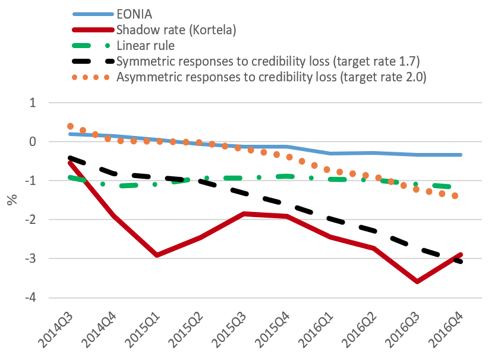
4b. Alternative specification of the symmetric reaction function with a lower inflation target
Sources: ECB, authors’ own calculations and Kortela (2016) for the shadow rate.
Conclusions
The Governing Council of the ECB “aims to maintain inflation rates below, but close to, 2% over the medium term”. This definition of price stability is ambiguous and potentially problematic. According to our analysis, the ECB’s monetary policy can be characterised by either as having the de facto inflation target reasonably far below 2%, or as reacting asymmetrically to inflation rates around 2%.
The ECB’s asymmetric response to inflation and/or low de facto inflation target may hamper its ability to achieve price stability. First, when approaching the inflation target from below, the central bank may need to tolerate inflation rates above the target. Overshooting the target for a limited time may facilitate the central bank to achieve its price stability objective faster and more efficiently, when the interest rates are at the zero-lower bound. Under credible monetary policy, overshooting the target raises inflation expectations and lowers the ex-ante real interest rate. This boosts consumption and investment and therefore reduces economic slack. Second, for a given equilibrium real interest rate, anchoring of inflation expectations to a relatively low level also leads to low nominal rates over the business cycle. This increases the likelihood of hitting the zero lower bound and reduces the scope to absorb shocks in severe economic downturns, like the ones the Eurozone has experienced since the Global Crisis.
Authors’ note: The views expressed in this column are those of the authors and do not necessarily reflect the views of the Bank of Finland or the Eurosystem.
*About the authors:
Maritta Paloviita, Adviser, Monetary Policy and Research Department, Bank of Finland
Markus Haavio, Adviser, Monetary Policy and Research Department, Bank of Finland
Pirkka Jalasjoki, Economist, Monetary Policy and Research Department, Bank of Finland
Juha Kilponen, Head of Forecasting, Monetary Policy and Research Department, Bank of Finland
References:
Kortela, T (2016), “A shadow rate model with time-varying lower bound of interest rates”, Bank of Finland Research Discussion Paper No. 19.
Łyziak, T, and m Paloviita (2017), “Anchoring of inflation expectations in the euro area: Recent evidence based on survey data”, European Journal Political Economy, 46, 52-73.
Neuenkirch, M, and P Tillmann (2014), “Inflation targeting, credibility, and non-linear Taylor rules”, Journal of International Money and Finance, 41, 30-45.
Paloviita, M, M Haavio, P Jalasjoki, and J Kilponen (2017), “What does “below, but close to, two percent” mean?”, Bank of Finland Discussion Paper No. 29.
Taylor, J B (1993), “Discretion versus policy rules in practice”, Carnegie-Rochester Conference Series in Public Policy, 39, 195-214.
Endnotes:
[1] More specifically, the credibility loss term is defined as an average deviation of past inflation from the target times the absolute value of that deviation.

