

Money Supply Growth Dropped In May To 15-Month Low – OpEd
By MISES
By Ryan McMaken*
Money supply growth slowed again in May, falling for the third month in a row, and to a 15-month low. That is, money supply growth in the US has come down from its unprecedented levels, and if the current trend continues will be returning to more “normal” levels. Yet, even with this slowdown, money-supply growth remains near some of the highest levels recorded in past cycles.
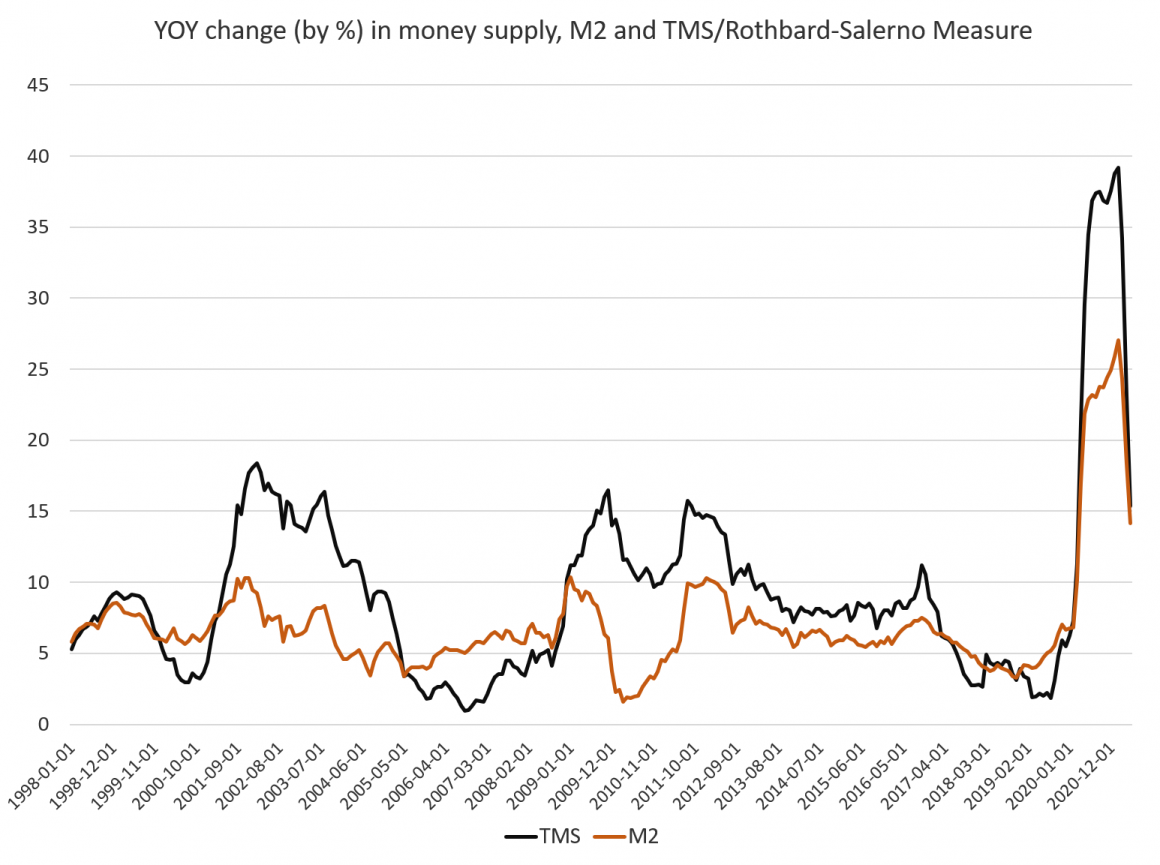
During May 2021, year-over-year (YOY) growth in the money supply was at 15.3 percent. That’s down from April’s rate of 23.1 percent, and down from the May 2020 rate of 29.5 percent. Growth peaked in February 2021 at 39.2 percent.
Historically, the growth rates during most of 2020, and through April of this year, were much higher than anything we’d seen during previous cycles, with the 1970s being the only period that comes close.
The central bank continues to engage in a wide variety of unprecedented efforts to “stimulate” the economy and provide income to unemployed workers and to provide liquidity to financial institutions. However, “emergency” government spending appears to be slowing from the unprecedented levels experienced during 2020, and this is likely showing up in declining money-supply growth. Nonetheless, Congress continues to turn to very large amounts of borrowing, and in order to keep interest rates low, the Fed has been buying up trillions of dollars in assets—including government debt. This has fueled new money creation.
The money supply metric used here—the “true” or Rothbard-Salerno money supply measure (TMS)—is the metric developed by Murray Rothbard and Joseph Salerno, and is designed to provide a better measure of money supply fluctuations than M2. The Mises Institute now offers regular updates on this metric and its growth. This measure of the money supply differs from M2 in that it includes Treasury deposits at the Fed (and excludes short-time deposits, traveler’s checks, and retail money funds).
Similar to the TMS measure, the M2 growth rate slowed in Spring 2021, dropping to 14.1 percent during May 2021, down from 18.3 percent during April 2021, and down from May 2020’s rate of 21.8 percent. M2 growth peaked at a new high of 27.0 percent during February 2021 before declining in March, April, and May.
Money supply growth can often be a helpful measure of economic activity, and an indicator of coming recessions. During periods of economic boom, money supply tends to grow quickly as commercial banks make more loans. Recessions, on the other hand, tend to be preceded by periods of slowing rates of money supply growth. However, money supply growth tends to grow out of its low-growth trough well before the onset of recession. As recession nears, the TMS growth rate typically climbs and becomes larger than the M2 growth rate. This occurred in the early months of the 2002 and the 2009 crises. A similar pattern appeared before the 2020 recession, suggesting the US was headed for a recession even before the covid shutdowns.
Recession did become a reality in the Spring of 2020 with the the second, third, and fourth quarters of 2020 all showing negative growth in real GDP. Real GDP was down 9 percent, year over year, during the second quarter, and still down 1.8 percent for the fourth quarter of 2020. Although year-over-year GDP growth was positive during the first quarter of 2021 (at 0.5 percent) this represents very weak growth given the enormous amounts of monetary and fiscal stimulus that have poured into the larger economy. Considering the Fed’s reluctance to scale back stimulus plans, it appears there is little confidence that the economy would stay in positive territory without ongoing stimulus. At Last month’s FOMC meeting, Fed officials announced there would be no increases in the target interest rate until 2023, at the earliest.
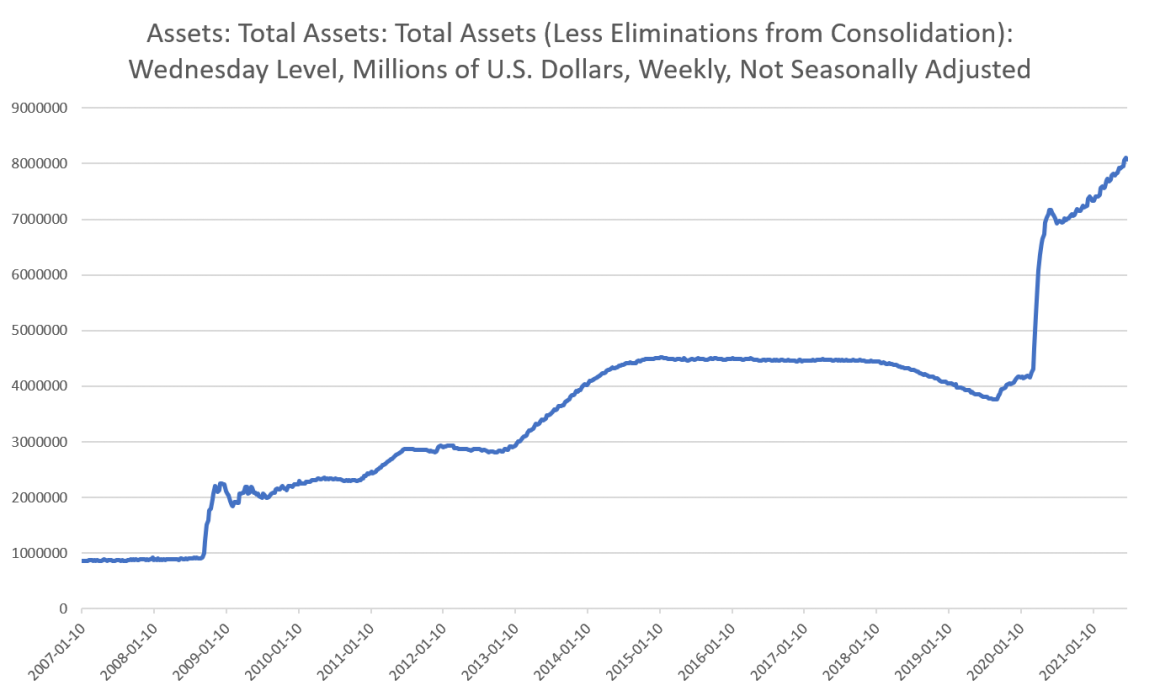
Another factor in money supply growth has been growth in the Fed’s balance sheet. After initial balance sheet growth in late 2019, total Fed assets surged to nearly $7.2 trillion in June and have rarely dipped below the $7 trillion mark since then. Assets have now reached a new all-time high above $8 trillion. These new asset purchases, fueled by newly-created money, are propelling the Fed balance sheet far beyond anything seen during the Great Recession’s stimulus packages. The Fed’s assets are now up more than 600 percent from the period immediately preceding the 2008 financial crisis.
Total Fed assets, going back to 2007:
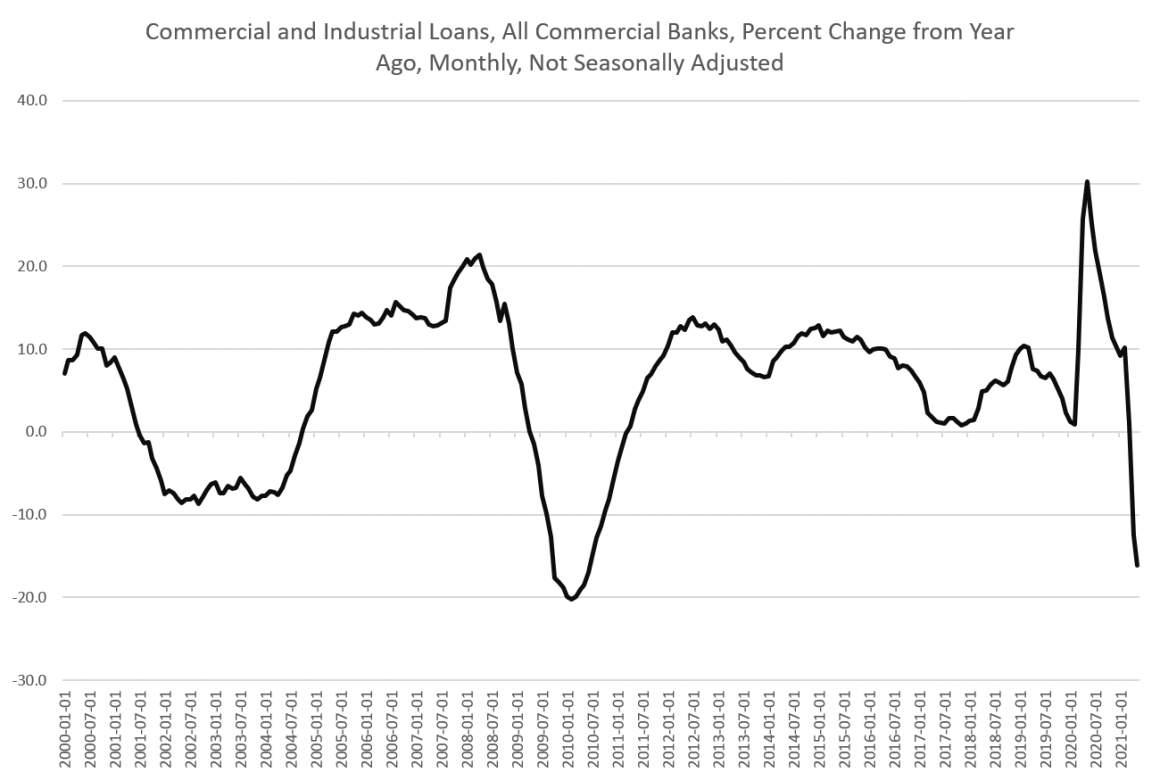
Some other factors are working to depress money creation, however. For example, commercial and industrial loans have been slowing, year over year, since February, with loan growth dropping from 10.1 percent in February to negative 16.1 percent in May. This is the largest decline since 2009. When loan activity drops, this will put downward pressure on money-supply growth.
*About the author: Ryan McMaken (@ryanmcmaken) is a senior editor at the Mises Institute. Send him your article submissions for the Mises Wire and Power&Market, but read article guidelines first. Ryan has degrees in economics and political science from the University of Colorado and was a housing economist for the State of Colorado. He is the author of Commie Cowboys: The Bourgeoisie and the Nation-State in the Western Genre.
Source: This article was published by the MISES Institute
Big difference between theory and practice. The metric that was developed by Murray Rothbard and Joseph Salerno is fallacious. And Jerome Powell just rewrote history, covering up the past money supply time series.
As Friedman said: ““Inflation is always and everywhere a monetary phenomenon in the sense that it is and can be produced only by a more rapid increase in the quantity of money than in output.”
Is the raw data for the Rothbard-Salerno graph available somewhere?
Thanks