Climate Change And The Cost Of Inaction – Analysis
By VoxEU.org
Policy proposals to offset the effects of global warming would be strengthened if we knew more about the net economic benefits of climate action relative to business-as-usual. This column argues that estimates may understate the future costs of business as usual because of heterogeneous seasonal effects, and because more business sectors than previously assumed suffer a negative impact from increased summer temperatures. The cost of inaction may be equal to one-third of the growth rate of US GDP over the next 100 years.
By Ric Colacito, Bridget Hoffmann and Toan Phan*
On Earth Day, 22 April 2016, 191 countries signed the historic Paris Climate Agreement (United Nations 2015). The primary objective is to limit global warming to 2°C above pre-industrial levels by the end of the century, and to pursue efforts to limit this increase to 1.5°C. If implemented, this landmark agreement will have far-reaching economic effects. The success of the agreement depends on its popular support, especially in developed countries like the US, in which there is political and legal opposition. This policy debate will be strengthened if we focus on the net economic benefits of climate action relative to business as usual.
To date, much of the research on the impact of rising temperature on economic activity concerns only developed, rather than developing countries (Dell et al. 2012). Also, it has examined the small fraction of economic activities that are naturally exposed to outdoor weather conditions, such as agriculture (Nordhaus 2014). Our research provides direct evidence of a strong negative effect from rising summer temperatures on a wider range of US economic activity (Colacito et al. 2016).
We combined our estimated impact coefficient with projections of the expected temperature increases under different emissions scenarios provided by climatologists. Our analysis ignores the potential effects of new technologies to cope with rising temperatures, but it measures the cost of inaction.
We calculated that the cost of climate change could be as large as one-third of the growth rate of US GDP over the next 100 years.
Measuring the impact of rising temperatures on US economic activity
We exploited random fluctuations in seasonal temperatures across years and states, using the richness of historical data available in the US. We employed a panel regression framework with the growth rate of gross state product (GSP) and average seasonal temperatures for each US state, and found that summer and autumn temperatures have opposite effects on economic growth. An increase in the average summer temperature negatively affects the growth rate of GSP. An increase in the autumn temperature positively affects this growth rate, although to a lesser extent. This suggests that previous studies’ aggregation of temperature data into annual temperature averages may mask the heterogeneous effects of different seasons.
The summer effect is particularly pronounced in data since 1990. This leads to a negative net economic effect of rising temperatures. This implies that the US economy is still sensitive to temperature increases, despite the adoption of adaptive technologies such as air conditioning (Barreca et al. 2015). Temperature also has a stronger effect in states with relatively high summer temperatures, most of which are located in the south.
A pervasive effect
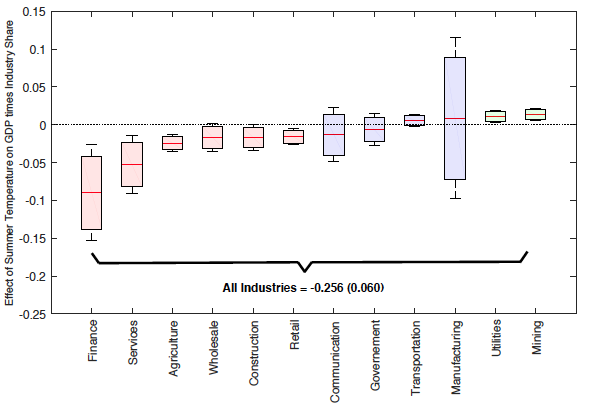
Our analysis quantified the effect of rising temperatures across sectors of the US economy. We find that an increase in average summer temperature has a pervasive effect on all industries, not just the sectors that are traditionally assumed to be vulnerable to climate change. Figure 1 shows that, in the most recent part of our sample, an increase in the average summer temperature has a negative effect on the growth rate of output of many industries, including finance, services, retail, wholesale, and construction that represent more than a third of gross domestic product (GDP). Only a few sectors such as utilities (1.8% of GDP) benefit from an increase in the average summer temperature.
Labour productivity is one of the channels through which temperature affects economic activity. In our empirical analysis, an increase in the average summer temperature decreased the annual growth rate of labour productivity. An increase in the average autumn temperature had the opposite effect. Our analysis used data at the macroeconomic level, but it is consistent with existing studies of this relationship at the microeconomic level (Zivin and Neidell 2014, Cachon et al. 2012, Zivin et al. 2015).
Figure 1 Decomposition of the summer temperature effect in the cross-section of industries

Quantifying the short- and long-term effects of climate change
The size of this impact on growth depends on the time horizon. When comparing one year to the next, the net effect of temperature is small. According to our estimates, a 1°C increase in the average summer temperature is associated with a reduction in the annual GSP growth rate of 0.086 percentage points, and a 1°C increase in the average fall temperature is associated with an increase in the annual GSP growth rate of 0.057 percentage points. Therefore, a uniform warming of 1°C across both seasons reduces economic growth by about 0.03 percentage points. The aggregate effect in one year appears too small to influence political debate.
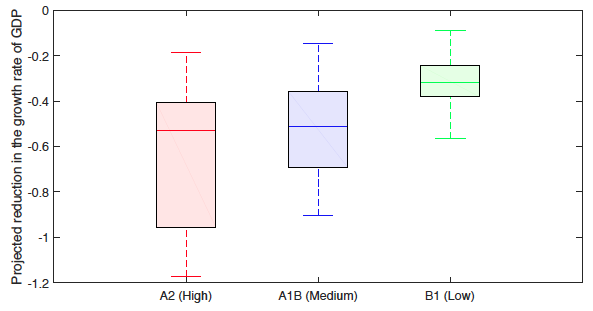
The cumulative effect over longer horizons, such as those of the Paris Agreement, is significantly greater. We looked at the projected monthly temperature increases for the US for the period 2070-2099 from 16 general circulation models (GCMs) under three different IPCC greenhouse gas emissions scenarios: A2 (high emission), A1B (medium emissions), and B1 (low emissions). We combined each set of temperature projections with our estimated impact coefficients. Figure 2 shows that, in the most conservative scenario (B1), the projected trend is expected to reduce the growth rate of US output by 0.2 to 0.4 percentage points by the end of the century. At the historical growth rate of US GDP of 4% per year, this would correspond to a reduction of up to 10%. The results are even more dramatic in the high emissions scenario (A2). Here, the reduction of economic growth could reach 1.2 percentage points, corresponding to roughly one-third of the historical annual growth rate of the US economy.
Figure 2 Projected reduction in the growth rate of GDP (2070-2099) under three emission scenarios

Our research forms part of a growing body of literature that provides strong evidence of global warming’s effects on the US economy (Deryugina and Hsiang 2014 and Bloesch and Gourio 2015). We have been able to quantify potentially significant effects of inaction and hope that our research, as well as other studies, can spur more ambitious climate initiatives.
Watch Bridget Hoffmann disuss the economic threat of climate change in the video below
*About the authors:
Ric Colacito, Associate Professor of Finance and Economics, University of North Carolina, Chapel Hill
Bridget Hoffmann. Economist, Inter-American Development Bank
Toan Phan, Assistant Professor of Economics, University of North Carolina, Chapel Hil
References:
Barreca, A, O Deschenes, and M Guldi (2015) “Maybe next month? Temperature shocks, Climate Change, and dynamic adjustments in birth rates,” NBER working paper No. 21681.
Bloesch, J and F Gourio (2015) “The effect of winter weather on US economic activity,” Economic Perspectives, 39 (1).
Cachon, G, S Gallino, and M Olivares (2012) “Severe Weather and Automobile Assembly Productivity,” working paper.
Colacito, R, B Hoffmann, and T Phan (2016) “Temperature and Growth: A Panel Analysis of the United States,” IDB Working Paper.
Dell, M, B F Jones, and B A Olken (2012) “Temperature shocks and economic growth: Evidence from the last half century,” American Economic Journal: Macroeconomics, 4 (3), 66–95.
Deryugina, T and S Hsiang (2014) “Does the Environment Still Matter? Daily Temperature and Income in the United States,” NBER working paper No. 20750.
Nordhaus, W D (2014) A question of balance: Weighing the options on global warming policies, Yale University Press.
United Nations/Framework Convention on Climate Change (2015) Adoption of the Paris Agreement, 21st Conference of the Parties, Paris: United Nations.
Zivin, J G and M Neidell (2014) “Temperature and the allocation of time: Implications for climate change,” Journal of Labour Economics, 32 (1), 1–26.
Zivin, J G, S Hsiang, and M Neidell (2015) “Temperature and Human Capital in the Short- and Long-Run,” NBER working paper No. 21157.

