Geographic-Area Waivers Undermine Food Stamp Work Requirements – Analysis
By Jamie Hall*
The Personal Responsibility and Work Opportunity Restoration Act of 1996—popularly known as welfare reform—instituted a work requirement for able-bodied adults without dependents (ABAWDs) who receive food stamps.1
They must work at least 20 hours per week, engage in job search or training, or volunteer in their communities in order to receive benefits. States may waive the work requirement for all recipients residing in any geographic area with an unemployment rate above 10 percent, or a lack of sufficient jobs, as determined by the Secretary of Agriculture. Through subsequent regulations, the second criterion has been interpreted, among other things, to allow a state to obtain a waiver in any area (as defined by the state) with a two-year average unemployment rate of 20 percent or more above the national average. States also have significant latitude to use this methodology to include areas with lower unemployment rates.2
This provision now provides the basis for all eight of the statewide waivers and 1,109 of the 1,125 partial waivers in effect.3 As a result, 3 million work-capable adults without dependents are not working and are not required to look for work in order to receive benefits. This situation occurs despite the fact that the national average unemployment rate recently fell to an 18-year low.
The House recently passed H.R. 2, the Agriculture and Nutrition Act of 2018, which rightly seeks to reform the food stamp program by encouraging work-capable individuals to work or participate in other activities in order to receive benefits. This is an important and worthy goal that would do much to promote human dignity and establish fairness between taxpayers providing assistance and beneficiaries. The bill’s provisions subject an estimated 2.9 million (29.4 percent) of work-capable, non-employed adults to a work requirement.4 While this is a step in the right direction, Congress should do more advance this goal.
A good place to start would be to strengthen H.R. 2’s modest—and insufficient—improvements to the waiver criteria.5 As drafted, the bill’s policy change is insufficient for correcting the current system’s core problems for several key reasons. First, as original research in this Backgrounder shows, geographic waivers based on unemployment rates are not the most effective policy.6
These waivers have—for two decades—resulted in situations where many areas are usually or always eligible for waivers, and most waivers go to those areas that are usually waived. This situation creates a dynamic in which, in theory, some work-capable individuals may receive SNAP benefits for their entire lives without looking for work even once. Moreover, unemployment-rate-based waivers are not the best way to provide targeted relief from work requirements to those in the greatest need during tough economic times. Under current law, eligibility for geographic area waivers peaks well after the unemployment rate, lagging the business cycle by one to two years, and continuing well after the need has passed. Even if Congress were to tweak the current law’s formula by adding a new unemployment-rate floor, as envisioned in H.R. 2, the floor would be irrelevant throughout most of the business cycle and therefore have a minimal overall impact on waiver eligibility.
Rather than tweak geographic waiver formulas, Congress should eliminate these waivers entirely. Such a change, if combined with other reforms,7 would encourage work-capable individuals to enter the workforce—even if they currently live in the least-prosperous areas of the country.
Under Current Food Stamp Regulations, Many Geographic Areas Are Usually—or Always—Waivable
Current regulations allow geographic-area waivers to be based on a percentage above the national average unemployment rate—allowing for the most part, the same areas to qualify for waivers year after year. This happens because the unemployment rate in counties tends to rise and fall with the national unemployment rate, with counties remaining in roughly the same order relative to one another over time.
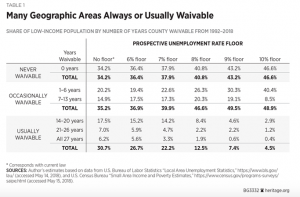 As shown in Table 1, 34.2 percent of low-income people live in areas that are never waivable, 35.2 percent live in areas that are occasionally waivable, and 30.7 percent live in areas that are usually waivable. Among that latter group is the 6.2 percent of low-income people who live in areas that, under current regulations, could have been exempted from work requirements in every single year since the government began to collect local-area-unemployment statistics. In other words, had the current SNAP work requirements been in place since 1992, and had states requested all available waivers, about 6.2 percent of work-capable potential SNAP recipients without dependents would have never been required to look for work even once in order to receive benefits for nearly three decades.8
Most Waivers Go to Those Who Live in Areas that Are Usually Waived
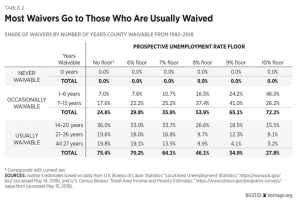 Because the same areas tend to qualify or not qualify for waivers year after year, current law allows the vast majority of waivers to go to individuals living in the areas that qualify more often than not.9
As discussed above, this is theoretical and provided to illustrate the allowable consequences of existing law.
Table 2 shows that 75.4 percent of waivers go to people in those areas that would have qualified for a waiver in at least 14 of the past 27 years, and 19.8 percent of waivers go to people in places that could have been waived in all 27 years. Thus, while geographic area waivers are theoretically available to every area on equal terms, those individuals who choose to reside in certain less-prosperous areas obtain the preponderance of their purported benefits.
Waivers Increase and Decrease Well After Unemployment
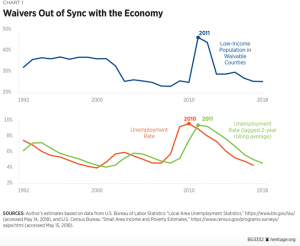 The situation described above indicates that current geographic-area-waiver criteria result in a system that fails to meet the goal of serving the low-income population during difficult economic times. Waivers become available well after the economic conditions that may warrant relief from a work requirement arrive—and then continue well after those conditions have passed.
Under the current system, waivers are tied to the local and national unemployment rates from the past two years. This approach is out of sync with the business cycle. The previous two-year-average unemployment rate—by definition—rises and falls a year or two after the current unemployment rate, guaranteeing that waivers come and go a year or two after they are most needed. The share of the low-income population residing in counties that are eligible for waivers generally rises and falls in tandem with the previous two-year-average national unemployment rate.
Chart 1 illustrates this situation. It shows that both the share of the low-income population residing in counties that are eligible for waivers and the previous two-year-average national unemployment rate peaked in 2011 and maintained nearly the same level in 2012. However, the highest unemployment rates of the Great Recession occurred during 2010, and the national unemployment rate was already declining by the time waiver eligibility peaked in 2011.
Understanding the Concentration of Existing ABAWDs
While the calculations presented in this Backgrounder are theoretical, based on the share of potential SNAP recipients who may be eligible for geographic-area waivers under various policies, it is important to understand that the share of actual SNAP recipients who are eligible for such a waiver is much higher. For example, Chart 1 shows that 27.1 percent of potential SNAP recipients lived in waivable areas in 2016. However, many ABAWDs who would be subject to a work requirement choose not to apply for SNAP benefits. Others choose to drop off of the rolls rather than comply with work requirements as the waivers expire.
Therefore, an estimated 63.2 percent of ABAWDs on the SNAP rolls received geographic-area waivers, while 13.3 percent received some other exemption from the work requirement, and only 23.5 percent fulfilled the work requirement in the year 2016.10
Thus, ABAWDs exempted from the work requirement by geographic-area waivers account for about twice the share of the SNAP caseload as would have been expected if these behavioral responses to policy were ignored, making addressing geographic-area waivers a more pressing policy concern.
Unemployment Floor Has Marginal Impact on Waiver Numbers
The House-passed version of H.R. 2 would introduce a floor on the unemployment rate that allows an area to qualify for a waiver, with the goal of substantially reducing waivers. As drafted, the floor will have little impact on waivers over the long term.
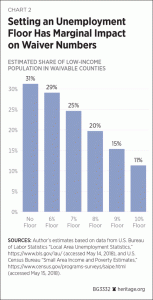 Congress has considered floors of both 6 percent (in the original version of H.R. 2) and 7 percent (as adopted in the Manager’s Amendment to H.R. 2 and passed in the House on June 21, 2018). An unemployment floor of either 6 percent or 7 percent would have a minimal, marginal impact on the number of granted geographic waivers. In the absence of a floor on the unemployment rate, 31.2 percent of the low-income population typically resides in an area that is eligible for a waiver, as shown in Chart 2. A 6 percent floor barely reduces this figure to 29.1 percent. A 7 percent floor reduces the figure to 24.6 percent.
In order to cut geographic-area waivers by half, policymakers would need to set a floor of nearly 9 percent—only 1 percentage point below the 10 percent unemployment rate that would make an area eligible for a waiver regardless of the national unemployment rate.
However, the reduction would vary greatly from year to year, as shown in Chart 3. The largest impact would be on the share of the low-income population that qualifies for a waiver in the year or two following a period of low unemployment (not necessarily during the period of low unemployment itself).
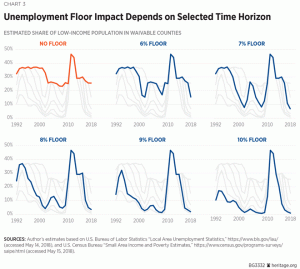 The floor would have little or no impact on waivers granted in the year or two following a period of high national unemployment (again, not necessarily during the period of high unemployment itself). This is significant because not only is the relief from the work requirement misaligned with the time during which is it most needed (as shown in Chart 1), it perpetuates a policy environment in which work-capable individuals residing in many areas will know well in advance that they need not even to try to find work in order to receive benefits for the next year or more, thereby reducing the urgency for them to find a job. For example, Chart 3 shows that a floor unemployment rate would not have affected waiver eligibility from 2011 to 2013, immediately following the Great Recession, when the previous two-year average national unemployment rate was at, or near, the floor.
By contrast, in 2018, following two years of low unemployment, the introduction of even a 6 percent floor would cut waivers by more than a third, from 25.5 percent to 15.4 percent of the low-income population. A 7 percent floor would further cut waivers by more than half, from 15.4 percent to 6.9 percent of the low-income population.
H.R. 2 Impact Estimates Depend on Time Horizon
Some estimates have erroneously suggested that the House-passed version of H.R. 2 will solve the problems associated with geographic-area waivers. Specifically, they claim the bill will cut waivers by up to 87 percent.11
However, such reductions are likely to occur only as the temporary product of an extraordinarily strong economy. The national unemployment rate—which currently stands at 4 percent but has averaged 6.2 percent over the past 50 years—needs only to reach or exceed 5.83 percent to make a 7 percent unemployment-rate floor irrelevant.12
This is why in Chart 3 waiver eligibility under a 7 percent floor is no different from waiver eligibility in the absence of a floor in many years, and why in Chart 2 a 7 percent floor reduces waiver eligibility only by about a fifth, on average. In other words, even though the unemployment-rate floor in H.R. 2 as passed by the House may substantially reduce waivers in fiscal year 2019, it will not matter at all in most years and will have little effect on overall waiver rates over the long term.
Conclusion
H.R. 2 sets a worthy goal of encouraging able-bodied food stamp recipients to work or prepare for work. Work helps to promote human dignity and establish reciprocity between beneficiaries and the taxpayers providing assistance. H.R. 2 takes steps towards achieving that goal. More should be done to encourage more work-capable food stamp recipients to work or prepare for work as a condition of receiving benefits. As passed in the House, the bill would subject an estimated 2.9 million (29.4 percent) of work-capable, non-employed adults to the work requirement.13
Therefore, Congress should go farther to achieve its goals. A good place to start is eliminating, rather than modifying, geographic-area waivers. The current process results in unintended consequences: The vast majority of geographic-area waivers from the food stamps work requirement go to people in places that are usually waivable, and a sizeable portion go to people in areas that would have been waivable every single year since the federal government began to publish local-area-unemployment statistics nearly three decades ago. Geographic-area waivers are based on the flawed premise that when the unemployment rate in an area exceeds a certain level, even in a national economic boom, work-capable people in that area should not be expected to look for work, whether in that area or in a neighboring city or county. Geographic waivers are not needed to protect vulnerable citizens’ access to food; other provisions exist or are available to give states the flexibility they need to provide exemptions from the work requirement for people facing difficulties.
About the author:
*Jamie Bryan Hall is Senior Policy Analyst in Empirical Studies in the Domestic Policy Studies Department, of the Institute for Family, Community, and Opportunity, at The Heritage Foundation.
Source:
This article was published by The Heritage Foundation
Notes:
[1] The program is officially named the Supplemental Nutrition Assistance Program (SNAP).
[2] In other words, if the national unemployment rate were to remain at its current level of 4 percent for two years, a geographic area would qualify for a waiver if it has an unemployment rate of at least 4.8 percent (4 percent x 120 percent = 4.8 percent) over those two years. A state may combine cities, counties, and other jurisdictions to create an “area” with an average unemployment rate at or above the relevant threshold—even though some of the components may have lower unemployment rates—in order to maximize the number of SNAP recipients whose work requirements are waived.
[3] The author obtained a Department of Agriculture file titled “Waiver Area Tracker May 2018.xlsx” via e-mail on May 15, 2018, which notes the statutory or regulatory provision cited in the state’s request for a waiver for each city, county, or other area. It is likely that many of the areas that are waived based on an unemployment rate 20 percent above the national average could qualify on some other basis instead if this provision were eliminated. In particular, some cities or counties within these areas are also Labor Surplus Areas, as designated by the Department of Labor, and, under current regulations, would qualify for a geographic-area waiver on that basis.
[4] Robert Rector and Jamie Bryan Hall, “Food Stamp Reform Bill Requires Work for Only 20 Percent of Work-Capable Adults,” Heritage Foundation Backgrounder No. 3315, May 10, 2018, https://www.heritage.org/hunger-and-food-programs/report/food-stamp-reform-bill-requires-work-only-20-percent-work-capable. The Manager’s Amendment to H.R. 2 subsequently made changes that modestly strengthened the work requirements.
[5] Changes include tightening the requirements for an area to qualify for an unemployment-based waiver (by requiring an unemployment rate of at least 7 percent) and restricting states’ ability to combine jurisdictions to obtain waivers for those areas that may not separately qualify (by allowing such combinations only in cases of Labor Market Areas, as designated by the Department of Labor).
[6] The calculations in this Backgrounder represent the theoretical waiver eligibility of potential SNAP recipients under a system in which counties must separately qualify for waivers, rather than the actual waiver status of SNAP recipients under current law and regulations. I define an “area” strictly as a county, due to the availability of both unemployment and low-income population data at the county level on an annual basis, which makes it possible to estimate the share of potential SNAP recipients who reside in counties that would be eligible for waivers. Unemployment data were obtained from: Bureau of Labor Statistics, “Local Area Unemployment Statistics,” https://www.bls.gov/lau/ (accessed May 14, 2018). Low-income population data were obtained from: U.S. Census Bureau, “Small Area Income and Poverty Estimates (SAIPE) Program,” https://www.census.gov/programs-surveys/saipe.html (accessed May 15, 2018). These two datasets were merged for this analysis. Because the number of people in an area with income below the poverty line is closely related to the number who would be eligible for SNAP, weighting the county data based on the low-income population is nearly equivalent to weighting it based on the number of potential SNAP recipients. Because both current law and H.R. 2 allow states to seek waivers for other jurisdictions, such as cities or Indian reservations, in addition to counties, and many individuals reside in multiple overlapping jurisdictions, some of which may qualify for waivers when the county does not, the calculations in this Backgrounder understate the share of the low-income population residing in waivable areas in a given year.
[7] For details, see Robert Rector, Jamie Bryan Hall, Mimi Teixeira, “Five Steps Congress Can Take to Encourage Work in the Food Stamps Program,” Heritage Foundation Issue Brief No. 4840, April 20, 2018, https://www.heritage.org/sites/default/files/2018-04/IB4840_1.pdf.
[8] This situation is theoretical; it is possible that no person has ever faced this situation. The data is provided to illustrate what the law allows, in order to give policymakers a better understanding of the matter.
[9] As discussed above, this is theoretical and provided to illustrate the allowable consequences of existing law.
[10] Author’s calculations based on United States Department of Agriculture, Food and Nutrition Service, “Supplemental Nutrition Assistance Program Quality Control Data, 2016,” October 2017, https://host76.mathematica-mpr.com/fns/ (accessed March 28, 2018).
[11] Jonathan Ingram and Nic Horton, “How the Agriculture and Nutrition Act of 2018 Would Rein in Work Requirement Waivers Gone Wild,” The Foundation for Government Accountability, June 11, 2018, https://thefga.org/research/how-the-agriculture-and-nutrition-act-of-2018-would-rein-in-work-requirement-waivers-gone-wild/ (accessed June 13, 2018).
[12] Under H.R. 2, an area must have a two-year average unemployment rate of at least 7 percent, or at least 20 percent above the national average, in order to qualify for a waiver under the relevant provision. Because 5.83 percent x 120 percent = 7.00 percent, the 7 percent floor has no effect on waiver eligibility when the national unemployment rate is at least 5.83 percent.
[13] Robert Rector and Jamie Bryan Hall, “Food Stamp Reform Bill Requires Work for Only 20 Percent of Work-Capable Adults,” Heritage Foundation Backgrounder No. 3315, May 10, 2018, https://www.heritage.org/hunger-and-food-programs/report/food-stamp-reform-bill-requires-work-only-20-percent-work-capable. The Manager’s Amendment to H.R. 2 subsequently made changes that modestly strengthened the work requirements.

