

Citizenship And Immigration Statuses Of US Foreign-Born Population – Analysis
By CRS
By Holly Straut-Eppsteiner
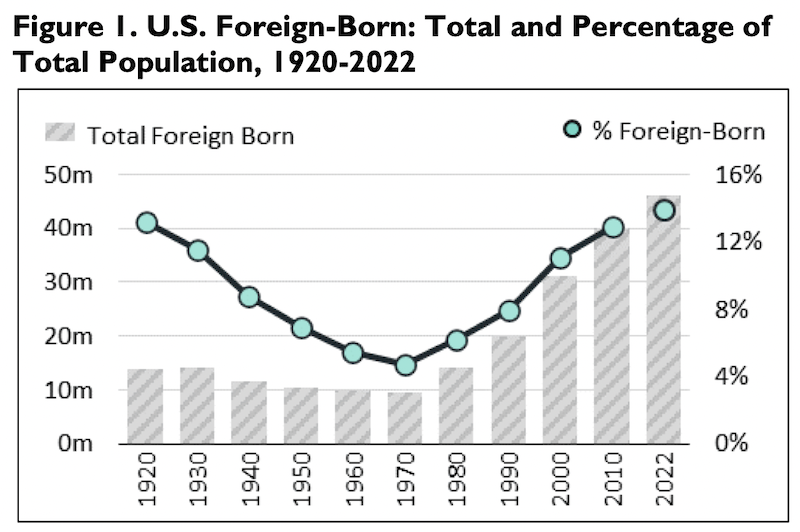
The U.S. foreign-born population consists of individuals living in the United States who were not U.S. citizens at birth. In 2022, according to the American Community Survey (ACS), an estimated 46.2 million foreign-born people resided in the United States, representing 13.9% of the total U.S. population. The ACS is a U.S. Census Bureau survey conducted each month with a sample of households in 50 U.S. states, the District of Columbia, and Puerto Rico.
The proportion of foreign-born individuals among the total U.S. population has changed over time. Census data for the period from 1850 to 2000 show the foreign-born population was at its highest proportion (greater than 14%) in 1910, 1890, and 1870.
Data from the last century show that the percentage of foreign-born persons in 1920 (13.2%) was similar to current levels. It then declined over the next five decades, reaching a low of 4.7% in 1970. Over the last five decades, the proportion has increased (Figure 1).
The foreign-born are heterogeneous with regard to citizenship and immigration status. They include the following:
- resident nonimmigrants, who are a subset of nonimmigrant (temporary) visa holders admitted for a limited period of time and specified purpose whose classes of admission are associated with U.S. residency, including temporary workers, students, exchange visitors, and diplomats;
- lawful permanent residents (LPRs, or green card holders), who can reside and work lawfully and permanently in the United States;
- naturalized U.S. citizens, who acquired U.S. citizenship generally after fulfilling residency and other requirements; and
- unauthorized immigrants who have entered the United States without inspection or have overstayed their period of lawful admission, including those who hold a temporary, discretionary status such as Deferred Action for Childhood Arrivals (DACA) or Temporary Protected Status (TPS).
Researchers find that government surveys tend to undercount the foreign-born population, particularly the unauthorized, compared with the native-born population. Because of these undercounts, and different survey and administrative data sources used, the sum of the subgroups enumerated in each section of this In Focus exceeds the total foreign-born population as measured by the ACS.
Resident Nonimmigrants
Nonimmigrant visas are issued to foreign nationals for specific purposes and on temporary bases. Typically, the Department of State (DOS) has issued 9 million to 10 million nonimmigrant visas annually. Nonimmigrant visa issuances were substantially lower in FY2020 (4 million) and FY2021 (2.8 million) due to COVID-19-related closures at U.S. embassies and consulates, the temporary suspension of entry for some categories of nonimmigrants during those years, and travel disruptions. In FY2022, nonimmigrant visa issuances increased to 6.8 million.
The majority of nonimmigrant visas issued are in categories related to nonresidential purposes (e.g., tourists). However, some nonimmigrants are admitted for purposes associated with U.S. residence. Approximately 3.2 million nonimmigrant workers, students, exchange visitors, diplomats, and their relatives were residing in the United States in 2019, according to the most recent Department of Homeland Security (DHS) estimate. Nonimmigrant workers represented the largest category (1.4 million).
LPRs
DHS estimates that 12.9 million LPRs lived in the United States in 2022. Typically, approximately 1 million people become LPRs each fiscal year. Like nonimmigrant admissions, LPR admissions for permanent residence were relatively low in FY2020 (707,362) and FY2021 (740,002) likely due largely to the COVID-19 pandemic. Admissions increased to 1,018,349 in FY2022; 46% were new arrivals to the United States and 54% adjusted to LPR status from a nonimmigrant status within the United States.
The largest number of LPRs are admitted through family- sponsored categories, followed by employment-based categories, grants of refugee status and asylum, and the diversity visa (DV) program (Figure 2).
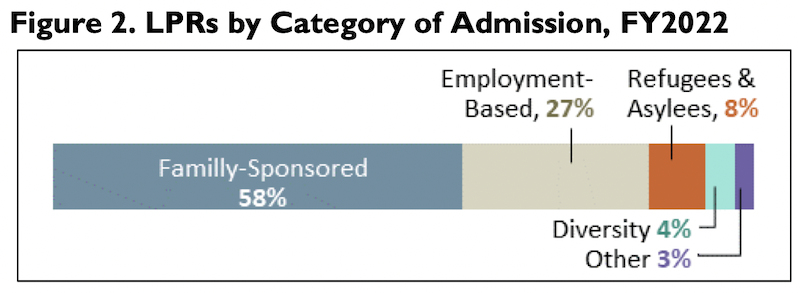
Statutory caps limit the annual number of individuals who can be granted LPR status through the family-sponsored system (480,000), employment-based system (140,000), and DV program (55,000). Family-sponsored categories include numerically limited (226,000) preference immigrants and numerically unlimited immediate relatives of U.S. citizens. Therefore, the number of persons who acquire LPR status through the family-sponsored system may, and regularly does, exceed its annual permeable limit. LPRs from any single country cannot exceed 7% of the total annual limit of numerically limited family-sponsored and employment-based preference immigrants.
DHS estimates that 9.2 million LPRs were eligible to naturalize, or become U.S. citizens, in FY2022, based on meeting U.S. residence and other requirements for application.
Naturalized Citizens
Approximately 24.5 million foreign-born individuals in the United States are naturalized U.S. citizens, representing about half (53%) of the foreign-born population in 2022. In FY2022, 969,380 individuals naturalized.
During the last century, the proportion of naturalized citizens relative to the total foreign-born population peaked in 1950 (74.5%) and then declined, reaching its lowest point (40.3%) in 2000, before increasing to its current level (Figure 3).
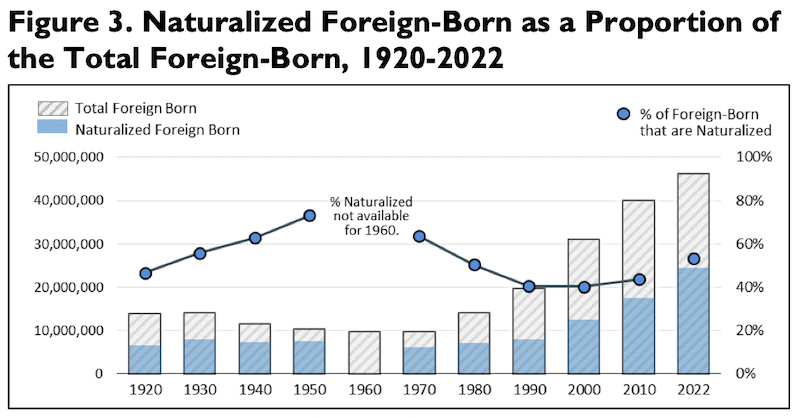
Note: The 1960 Decennial Census did not ask respondents about their citizenship status.
Unauthorized Population
The unauthorized population is challenging to measure. There are no official counts of unauthorized immigrants living in the United States. Census Bureau surveys like the ACS measure whether an individual is foreign-born and whether they are a U.S. citizen but most do not collect information on immigration status. However, federal agencies and nongovernmental researchers have long produced estimates of the unauthorized population, drawing on survey data and various methodologies.
Recent estimates range from 10.3 million to 11.4 million unauthorized individuals living in the United States. Based on these estimates, the unauthorized population represents about 23% to 26% of all foreign-born individuals living in the United States.
Some policies allow certain foreign nationals to remain in the United States regardless of whether they have a lawful immigration status, but they do not provide pathways to LPR status. Individuals covered by these programs are generally included in unauthorized population estimates. They include individuals granted TPS (610,630 as of March 2023), which is a blanket form of humanitarian relief; and DACA (578,680 as of March 2023), which is granted to certain eligible persons brought to the United States as children.
Other individuals may be allowed to remain in the United States temporarily with immigration parole, also referred to as humanitarian parole, on a case-by-case basis, for urgent humanitarian reasons or significant public benefit. In recent years, the Biden Administration has extended special parole processes for particular populations who meet specific criteria. There is no publicly available government source of the total number of individuals residing in the United States with parole grants.
Recent Migrant Arrivals in Removal Proceedings
During the past two years, the United States has experienced an unprecedented level of migration at the U.S.-Mexico border by individuals who, in many cases, are seeking asylum and do not otherwise have permission to enter the country. Individuals who are charged with an immigration violation by DHS may pursue their asylum claims in the removal process and, if they are not subject to mandatory detention, may be released to reside temporarily in the United States while they await their removal (deportation) proceedings in immigration court.
In FY2022, DHS’s U.S. Customs and Border Protection (CBP) released 780,000 migrants. In FY2023 (through August), CBP charged and released approximately 764,000 migrants who are awaiting removal proceedings (according to CBP Custody and Transfer Statistics). Some of these individuals are covered by certain legal protections such as humanitarian parole or TPS; others may be released with no other status or protection.
About the author: Holly Straut-Eppsteiner, Analyst in Immigration Policy
Source: This article was published the Congressional Research Service (CRS).