New US Supplemental Poverty Numbers: Do They Paint An Accurate Picture? – Analysis
By Shawn Fremstad for CEPR
On Monday, the Census Bureau released poverty estimates for 2010 using the new Supplemental Income Poverty Measure (SPM) data. Earlier this year, Census published both national and state-level SPM poverty estimates for 2009.1
The Census data show that SPM poverty was modestly higher than official poverty in both 2009 and 2010. The SPM also produces more significant changes in the demographics and geographic distribution of poverty. Compared with the official poverty measure, the SPM shows lower poverty rates for children and declines in state-level poverty rates in most states. While the SPM improves on the outdated official poverty measure in several respects, some of the results suggest that the SPM also has serious defects that need to be addressed. More generally, the SPM does not address the most fundamental problem with the official poverty measure—the extent to which it has “defined deprivation” down over the last several decades because it has not kept pace with changes in typical living standards in the United States.
A Modest Increase in Overall Poverty Compared With Official Measure
Using the official poverty measure, 46.6 million people (15.2 percent) had incomes below the poverty line in 2010. Poverty is modestly higher using the supplemental measure—49.1 million people (16.0 percent) in 2010.
A recent news story in the New York Times, based in part on alternative poverty data previously published by Census, suggested that the “bleak portrait of poverty” painted by the official numbers is “off the mark” and that alternative measures show slower increases in poverty. The new SPM numbers for 2010 do not support that conclusion. In addition to a somewhat higher overall poverty number under the SPM, poverty increased at roughly the same rate between 2009 and 2010—0.7 percentage points—under both the official measure and the SPM.
 It is also worth noting that the small increase in overall poverty under the SPM may prove to be ephemeral. The poverty threshold under the SPM is linked to recent trends in consumer expenditures on housing, utilities, food and shelter at the 33rd percentile of the expenditure distribution. Between 2008 and 2010, average expenditures on these items by families in the second quintile of the income distribution have declined by nearly $500, which implies that the SPM threshold could decline in value compared with the official poverty measure over the next several years.
While the overall poverty rate does not change much under the SPM compared with the federal poverty level (FPL), there are a number of notable changes in the demographics of poverty:
- There is an extraordinary increase in the elderly poverty rate—SPM elderly poverty is 77 percent higher than official elderly poverty.
- There is a large decline in the child poverty rate—SPM child poverty is almost 20 percent lower than official child poverty.
- Poverty rates are higher for married couples and male-headed households under the SPM than under the FPL, but about the same for female-headed households.
- Poverty rates are lower for African-Americans under the SPM than the FPL, but higher for whites, Asians, and Latinos (any race).
- Poverty rates are lower for renters under the SPM than under the FPL, but higher for homeowners, including homeowners with no mortgage.
- Poverty is much higher in the West (about 4 percentage points higher) but lower in the South and Midwest.
 SPM Likely Undercounts Child Poverty
As noted above, the SPM poverty rate for the elderly is 77 percent higher than the official poverty rate for the elderly.
Considered in isolation, the increase in the elderly poverty rate is unobjectionable and is arguably an important indicator that more attention needs to be paid to poverty among the elderly.
However, when considered in relation to the decrease in child poverty— the SPM counts about 3.2 million fewer children as poor compared with the official poverty measure—it raises a question about whether the resulting rates are consistent with differences in other forms of economic hardship between children and the elderly.
As the table above shows, under the official poverty rate, child poverty is about twice the level of elderly poverty, while under the SPM, poverty rates for the two groups are similar. If a poverty measure is accurate, it should reflect other differences in hardships related to basic needs. The best single alternative indicator of economic insecurity related to a basic need is the food insecurity and hunger measure published annually by USDA. This measure shows that the rate of food insecurity and hunger among children is more than twice that among the elderly.
 Similarly, the elderly make up a much smaller share of the population suffering from various economic hardships—measured using an index of material hardship, an indicator of high debt, and responses to a survey question about inability to meet expenses—than they do of the population living in poverty under either the official or the SPM measure.
Higher rates of directly measured economic hardship among children than among the elderly are not surprising.
The elderly have a stronger and more stable set of social insurance protections (basically near-universal guaranteed income support and health insurance) than children in the United States. The single largest income security program for low- and moderate-income parents with children—the Earned Income Tax Credit—only provides benefits to employed parents. Moreover, unlike Social Security benefits, which are paid on a monthly basis, EITC benefits are paid to parents once a year as a lump sum.
To ensure that the SPM child poverty rate better reflects the economic hardship and insecurity experienced by children, consideration should be given to adjusting the poverty threshold to account for necessities parents need in order to raise a child. Currently, the SPM assumes that children and the elderly have the same basic needs. As a result, the unique developmental and educational needs of children that go beyond food, clothing and housing are ignored or assumed to be costless.

The spike in elderly poverty under the SPM is due in part to the subtraction of out-of-pocket medical expenditures from income, something that the official poverty measure does not do. Unfortunately, the SPM does not directly assess unmet medical needs (or child care needs).
As a result, a single parent with no health insurance and little or no ability to pay for preventive or other health care out of pocket may end up looking better off than an elderly person with guaranteed income support and health insurance who is able to pay out-of-pocket for medical care that isn’t covered by Medicare.
The poverty rate for people without health insurance is only slightly higher under the SPM than under the official measure—30.7 percent of the uninsured are poor under the SPM compared with 29.2 percent of the uninsured under the official measure. There are bigger changes in poverty, however, among people with insurance (a 2.7 percentage point increase for those with private insurance, and a -5.9 percentage point decrease for those with public health insurance). This suggests that the SPM may not be adequately capturing the effect that unmet medical needs have on poverty among the uninsured. One way to address this problem would be to adjust the poverty threshold upward for the uninsured.
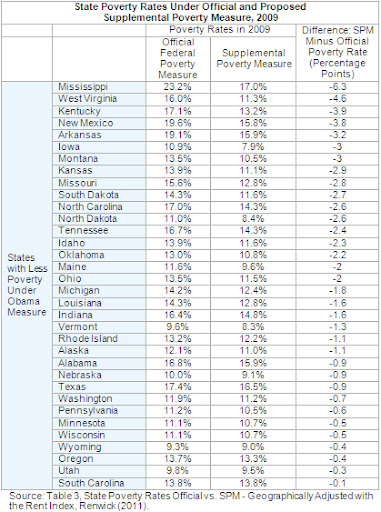
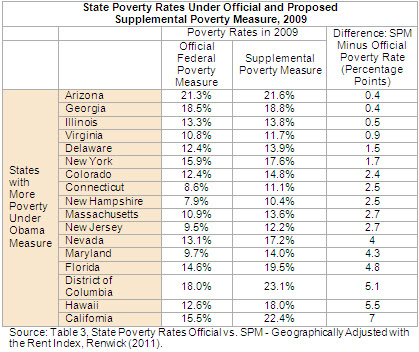
SPM Poverty Rates Would Be Lower in Most States than Official Poverty
Census has not yet published state-level SPM poverty rates for 2010, but they did publish (in a research paper on the Census website) 2009 state-level estimates.

These estimates show that in most states, the SPM would result in lower poverty rates (and poverty thresholds) than the current official measure. As the table shows, SPM poverty rates under the Obama measure would be lower than official poverty rates in 34 states and higher in 16 states and the District of Columbia. (The rates are from tables on the Census website that were prepared by Trudi Renwick, the Chief of the Poverty Statistics Branch at Census).2
It is particularly striking that the biggest declines in poverty rates under the Obama measure would occur in many of the poorest states. Among the 10 states with the lowest per capita GDP, 6 are also in the top 10 of the states that would see the largest decline in poverty rates under the Obama measure.
This result is largely produced by two flawed elements of the SPM: 1) it adopts a poverty threshold that is far too low as a measure of what is needed to live a minimally decent life today (only $23,854 for a family of two parents and two children in 2009, according to the Administration); and 2) it adjusts this threshold for geographic differences in housing costs in a way that allows the poverty thresholds for many states and sub-state areas to actually fall below the outdated federal poverty threshold. At a minimum, the SPM thresholds should not be allowed to fall below the official poverty thresholds.
Author:
Shawn Fremstad is a Senior Research Associate at the Center for Economic and Policy Research and an expert on issues of poverty and inequality.
Notes:
[1]For background on the differences between the official poverty measure and the SPM, see Shawn Fremstad, A Modern Framework for Measuring Poverty and Basic Economic Security, Center for Economic and Policy Research, April 2010.
[2]The data is also available in this Excel file.
