
Mexico Energy Profile: Production And Exploration Is Growing – Analysis
By EIA
Pemex (Mexico’s state-owned oil company) reported a profit of 23 billion pesos ($1.2 billion) in 2022 aided by higher oil prices.1 This is the first time the company posted a profit in a decade on an annual basis. Pemex used a $2 billion bond to refinance some of its nearly $105 billion debt in the third quarter 2022.2
Although it accounts for a relatively small share of total spending, private investment in Mexico’s energy production and exploration is growing. In 2022, private companies funded 5% of total oil production, up from almost none in 2017.3
Recently, increasing private investment and rising condensate production helped reverse a downward trend in Mexico’s oil production that began in 2004. In 2022, Mexico’s oil production was nearly 2 million barrels per day (b/d), similar to levels since 2019. As of the March 2023 Short-Term Energy Outlook, we forecast that Mexico’s petroleum and other liquids production will average 1.93 million b/d in 2023 and 1.91 million b/d in 2024.
U.S. natural gas exports to Mexico via pipeline have increased more than 400% since 2011.
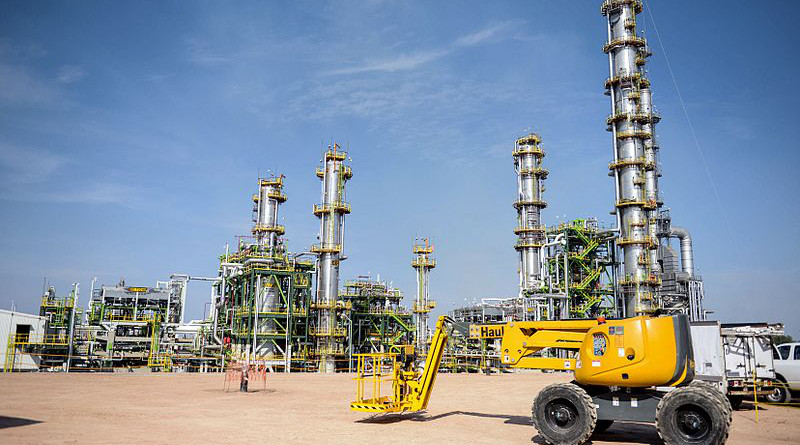
In 2022, Pemex purchased ownership in the Deer Park refinery in Houston for $596 million. In addition, a new refinery called Olmeca Dos Bocas, which will come online in 2023, was constructed at an estimated cost of $12 billion. New coker units in Tula and Salina Cruz refineries will come online in late 2023.4,5
Petroleum and other liquids
As of January 2023, Mexico’s proved oil reserves were 6.0 billion barrels, including crude oil, lease condensate, natural gas liquids, and oil sands.6 The Sureste Basin, which is located mostly offshore of Mexico’s southeast coast (previously known as the Campeche Basin) accounts for 81% of those reserves. Of the remaining reserves, 14% are in the Tampico-Misantla Basin, and 5% are in the Veracruz Basin.7
Mexico’s reserves are located 70% offshore (primarily in the Sureste Basin, which straddles both the onshore and offshore) and 30% onshore (primarily in the Tampico-Misantla Basin). Currently, no known reserves exist in deepwater. 8
Mexico’s production primarily originates from the Northeastern Marine Region of the Sureste Basin. Production data for 2022 show that Mexico’s three largest fields, together referred to as Ku-Maloob-Zaap, accounted for 551,000 b/d of production, falling by about 36% from their peak in 2013.9
| Field | Region | Start date | Peak production, thousand b/d (date) | Average production in 2022, thousand b/d |
|---|---|---|---|---|
| Maloob | Ku-Maloob-Zaab Sureste Basin Northeast Marine | 1985 | 432 (2018) | 275 |
| Zaap | Ku-Maloob-Zaab Sureste Basin Northeast Marine | 1992 | 305 (2014) | 238 |
| Quesqui | Sureste Basin Southwestern Marine | 2019 | 133 (2022) | 133 |
| Ayatsil | Sureste Basin Northeast Marine | 2015 | 94 (2021) | 86 |
| Xanab | Litoral De Tabasco Sureste Basin Southwestern Marine | 2009 | 160 (2017) | 82 |
| Balam | Sureste Basin | 1993 | 49 (2022) | 49 |
| Yaxché | Litoral De Tabasco Sureste Basin Southwestern Marine | 2006 | 56 (2012) | 48 |
| Data source: Base de Datos Institucional de Pemex y Comision Nacional de Hidrocarburos, Hydrocarbon Information System Note: b/d=barrels per day | ||||
Mexico produced an average of 1.9 million b/d of total petroleum and other liquids in 2022. Since 2019, Mexico’s production declines have slowed as private investment has increased and condensate production has risen (1). Mexico’s production peaked in 2004 at 3.8 million b/d.
In 2019, Pemex accounted for 96% of petroleum production while private firms accounted for 4% of production, a steadily growing share since 2017. As of December 2022, private companies accounted for 6% of production.10
Mexico’s refineries processed 815,790 b/d of crude oil and liquids in 2022 (Table 3).11 The new Olmeca Dos Bocas refinery is scheduled to begin operations in 2023, which will increase Mexico’s refining capacity approximately 1.98 million b/d. The new refinery will produce an estimated 280,000 b/d of gasoline and diesel fuel.12
| Refineries | Ownership | Location | Notes | Crude oil barrels per calendar day capacity (b/cd) | Vacuum distillation capacity (b/cd) | Crude oil runs (b/cd) |
|---|---|---|---|---|---|---|
| Cadereyta | Pemex | Cadereyta Jiménez | 275,000 | 123,900 | 118,764 | |
| Ciudad Madero | Pemex | Ciudad Madero | 190,000 | 91,300 | 97,982 | |
| Minatitlán | Pemex | Minatitlán | 285,000 | 129,000 | 111,829 | |
| Salamanca | Pemex | Salamanca | 245,000 | 119,000 | 129,615 | |
| Salina Cruz | Pemex | Salina Cruz | Coker unit expected in late 2023 | 330,000 | 165,000 | 177,869 |
| Tula | Pemex | Atitalaquía | Coker unit expected in late 2023 | 315,000 | 144,000 | 179,731 |
| Olmeca Dos Bocas | Pemex | Paraíso | Azule Energy | New refinery expected to increase production capacity from 2023 to 2026 | NA (340,000) | NA |
| Total | 1,640,000 | 772,200 | 815,790 | |||
| Data source: Base de Datos Institucional de Pemex y Comision Nacional de Hidrocarburos, Hydrocarbon Information System y Base de Datos Institucional (Accessed March 24, 2023) | ||||||
Natural gas
Mexico had 7.1 trillion cubic feet (Tcf) of proved natural gas reserves as of January 2023.13 Mexico’s southern region, primarily the Sureste Basin and Veracruz Basin, contains most of the country’s proved reserves.14 Technically recoverable shale gas resources are far smaller than the total resource base because of the geologic complexity and discontinuity of Mexico’s onshore shale zone.
Mexico produced 0.8 Tcf of dry natural gas in 2021, the lowest volume since the 1980s. Although the southern region of the country contains the largest share of proved reserves, the Burgos, Sabinas, and Burro-Picachos regions in the north have the potential to see reserves grow in the future.
Mexico’s dry natural gas production decreased every year since a high of 2.1 Tcf in 2009, while consumption steadily increased during the same period.
Similar to petroleum production, private production accounted for 5% of total natural gas production in 2022, and Pemex produced the remainder. Natural gas private production was less than 1% of production in 2017.15
Coal
Coal represents a small and decreasing share of Mexico’s total energy production and consumption.
Mexico’s Comisión Federal de Electricidad’s (CFE) plan for an additional coal power station in Coahuila was canceled in 2021, and no additional coal power plants have been proposed.16 Coahuila is the location of one of Mexico’s two coal-fired power plants and nearly all of Mexico’s coal production. 17
Electricity
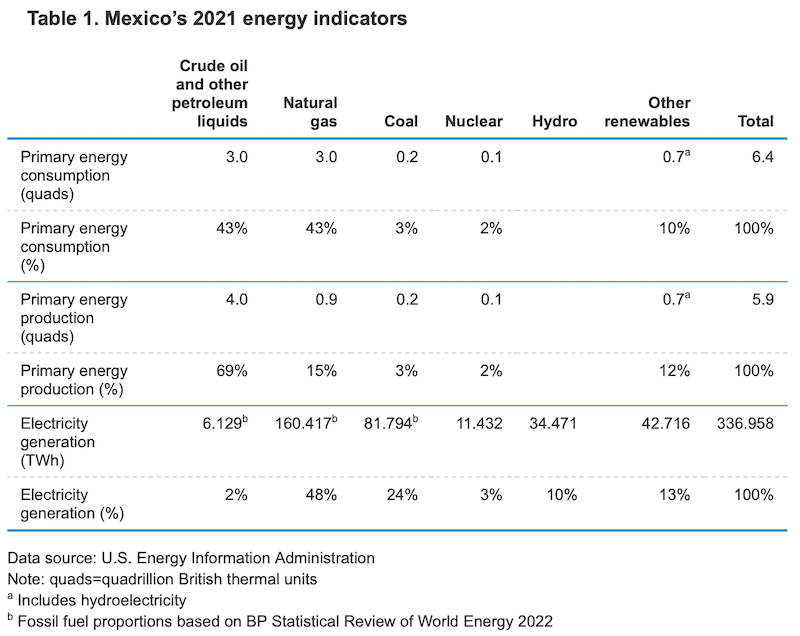
In 2021, Mexico generated 337,000 gigawatthours (GWh) and maintained 94 gigawatts (GW) of installed generation capacity.
The two reactors at the Laguna Verde power plant, Mexico’s only nuclear power plant, generated 4% of Mexico’s electricity. The plant has been licensed to operate through 2050 as of this year.18 The previous license for one of the reactors was set to expire in 2025.
Renewable generation in Mexico has grown. Total renewable capacity in 2021 was approximately 30 GW, and it mainly consisted of hydroelectricity (13 GW), wind (7 GW), and solar (8 GW). Mexico’s government plans to double the current renewable capacity by 2030, which would increase solar and wind capacity from 15 GW to 40 GW.19
Energy trade
Petroleum products are the largest component of energy trade between the United States and Mexico. In 2022, U.S. petroleum product exports to Mexico accounted for nearly 20% of all U.S. petroleum products.
Mexico’s crude oil and lease condensate exports totaled 1.16 million b/d in 2021, and they have been decreasing in all but two years, 2009 and 2017, since an all-time high of 2.12 million b/d in 2004.
Mexico sources most of its energy imports from the United States. U.S. natural gas pipeline exports to Mexico have increased more than 400% since 2011. U.S natural gas exports via pipeline totaled 2.1 trillion cubic feet (Tcf) in 2022 (Table 4). In 2022, the share of Mexico’s natural gas supply met by pipeline imports from the United States decreased by 4%, the first time since 2010. 20
Mexico’s consumption of liquefied natural gas (LNG) has decreased, but dry natural gas use has increased. This increase is due, in part, to expanded pipeline capacity between the United States and Mexico following recent construction on pipelines, one from the Valley Crossing to Sur de Texas-Tuxpan and the other between the Wahalajara system and Waha Hub.21,22
Other notable pipelines include the Nueva Era pipeline, which began operating in 2018.23
| Point of exit | Linked pipelines | Start date | 2022 flow volume (MMcf) |
|---|---|---|---|
| Rio Grande, Texas | 2014 | 547,381 | |
| Brownsville, Texas | Valley Crossing Pipeline and Sur de Texas-Tuxpan Pipeline | 2019 | 328,969 |
| Presidio, Texas | Wahalajara system and Trans-Pecos Pipeline | 2017 | 225,513 |
| San Elizario, Texas | Waha-San Elizario Pipeline | 2017 | 167,711 |
| Roma, Texas | 2003 | 137,494 | |
| Ogilby, California | 2002 | 121,907 | |
| Laredo, Texas | Nueva Era | 2018 | 113,451 |
| Other | 431,914 | ||
| Total | 2,074,340 | ||
| Data source: U.S. Energy Information Administration, U.S. Natural Gas Pipeline Exports by Point of Exit | |||
At 5.4 Bcf, U.S. LNG exports accounted for less than 1% of the total natural gas imported by Mexico in 2022. The United States and Indonesia were the largest suppliers of Mexico’s LNG imports in 2021. The average price of U.S. LNG was approximately double that of pipeline prices at $14.07/Tcf compared with $6.26/Tcf) in 2022.25
U.S. natural gas primarily came from the Permian Basin in West Texas via the Chihuahua-to-Bajio corridor, including the Samalayuca-Sásabe pipeline system and the Wahalajara system.26,27
- BNamericas. (2023, February 28). BNAMERICAS – Pemex returns to profit in 2022 and ups production. (Accessed March 24, 2023)
- Martinez, Ana Isabel. 2023. “Mexico’s Pemex Places $2 Bln Bond to Refinance Debt.“ Reuters, February 1, 2023, sec. Energy.
- Base de Datos Institucional de Pemex y Comision Nacional de Hidrocarburos, Hydrocarbon Information System (Accessed January 27, 2023)
- Reuters. 2021. “Mexico Says U.S. Approves Deer Park Refinery Deal, Sees Completion Early 2022“. Reuters, December 22, 2021, sec. Energy.
- “Mexico Works on Plan to Add Coker to Salina Cruz | Argus Media.“ 2022. Www.argusmedia.com. April 6, 2022.
- Oil & Gas Journal, Worldwide Reserves, January 1, 2023.
- Base de Datos Institucional de Pemex y Comision Nacional de Hidrocarburos, Hydrocarbon Information System (Accessed January 27, 2023)
- Base de Datos Institucional de Pemex y Comision Nacional de Hidrocarburos, Hydrocarbon Information System (Accessed January 27, 2023)
- Base de Datos Institucional de Pemex y Comision Nacional de Hidrocarburos, Hydrocarbon Information System (Accessed January 27, 2023)
- Base de Datos Institucional de Pemex y Comision Nacional de Hidrocarburos, Hydrocarbon Information System (Accessed January 27, 2023)
- Base de Datos Institucional de Pemex, Base de Datos Institucional (Accessed March 24, 2023)
- Reuters. 2022. “Mexico’s Newest Oil Refinery Now Seen Working at Half Capacity in Mid-2023“. US News & World Report, December 24, 2022.
- Oil & Gas Journal, Worldwide Reserves, January 1, 2023.
- Base de Datos Institucional de Pemex y Comision Nacional de Hidrocarburos, Hydrocarbon Information System (Accessed December 1, 2022)
- Base de Datos Institucional de Pemex y Comision Nacional de Hidrocarburos, Hydrocarbon Information System (Accessed January 27, 2023)
- Demos, Editorial, and Alejandro Alegría. n.d. “La Jornada – CFE No Construirá Centrales de Carbón Para Generar Energía.“ Www.jornada.com.mx. (Accessed March 2, 2023).
- “Panorama Minero del Estado de Coahuila (p 12)“ (PDF). Servicio Geológico Mexicano. December 2021.
- “Mexican Nuclear Cleared to Run into 2050s : Regulation & Safety – World Nuclear News.“ n.d. Www.world-Nuclear-News.org. (Accessed March 2, 2023).
- Reuters. 2022. “Mexico Vows to Double Renewable Energy Capacity by 2030.“ Reuters, November 15, 2022, sec. COP27.
- U.S. Energy Information Administration. “U.S. Natural Gas Exports to Mexico Are Increasing at the West Texas Border“. (Accessed March 2, 2023).
- U.S. Energy Information Administration. “U.S. Natural Gas Exports to Mexico Set to Rise with Completion of the Wahalajara System.“ (Accessed March 2, 2023).
- U.S. Energy Information Administration. “U.S. Natural Gas Exports to Mexico Are Increasing at the West Texas Border.“ (Accessed March 2, 2023).
- U.S. Energy Information Administration. “U.S. Natural Gas Exports to Mexico Set to Rise with Completion of the Wahalajara System.“ (Accessed March 2, 2023).
- U.S. Energy Information Administration. “U.S. Natural Gas Exports and Re-Exports by Point of Exit.” (Accessed March 2, 2023).
- U.S. Energy Information Administration. “U.S. Natural Gas Exports by Country.“ (Accessed March 2, 2023).
- U.S. Energy Information Administration. “U.S. Natural Gas Exports to Mexico Are Increasing at the West Texas Border.“ (Accessed March 2, 2023).
- U.S. Energy Information Administration. “U.S. Natural Gas Exports to Mexico.“ (Accessed March 2, 2023).