

What’s The Best Asset Allocation For Retirees?
By IESE Insight
There’s a lot to consider when choosing the best wealth management strategy during retirement. Most importantly, your investments should provide funds to sustain you throughout your post-retirement life. Another goal may be to bequeath leftover money to family or to charity.
The usual metric for evaluating different investment strategies is the “failure rate.” An investment strategy “fails” if it doesn’t provide funds throughout the planned retirement horizon — say, 30 years. However, the failure rate has two important weaknesses: it provides no insight as to when the strategy failed — for example, whether in year 5 or year 29 of a 30-year plan — and it does not record if a strategy left a surplus in the end.
Introducing the coverage ratio
To address the shortcomings of the failure rate and provide more information about different retirement investment strategies, IESE’s Javier Estrada and Mark Kritzman of Windham Capital Management have developed a new metric they call the coverage ratio. This calculation essentially measures the number of years of withdrawals supported by a particular strategy, relative to the length of the retirement period considered.
Estrada and Kritzman use their metric in a new framework to help determine the optimal mix of stocks and bonds based on historical data across 21 countries and the world market. (Hint: Going heavy on stocks has done best in the past.) Future scenarios are also simulated to see which asset-allocation strategies work if more pessimistic views about the future turn out to be true.
Applying the coverage ratio
How does the coverage ratio work? While the failure rate would only tell us whether or not a particular investment strategy failed to allow for withdrawals during that 30-year period, the coverage rate takes into account whether it failed 10 years in or 29 years in, or, if successful, whether it outlasted the 30-year period, providing, say, 36 years of withdrawals.
In practice, if the coverage ratio is 1.0, a strategy that was meant to provide withdrawals for 30 years did its job but left nothing at the end. Meanwhile, a ratio of 1.1 indicates the strategy provided cash flows for 30 years and left a bequest worth 3 years of withdrawals, while 0.9 indicates a strategy that failed by providing only 27 years of withdrawals.
The coverage ratio is superior to the failure rate because it overcomes the latter’s two basic flaws. However, the ratio doesn’t account for the fact that investors are likely to be more displeased when their investment strategy fails than they are pleased when the strategy succeeds with surpluses. So, the authors’ framework includes a utility function that penalizes failure more than it rewards success.
Using this framework, the researchers look at both historical and simulated scenarios to suggest optimal asset allocation strategies for stocks and bonds.
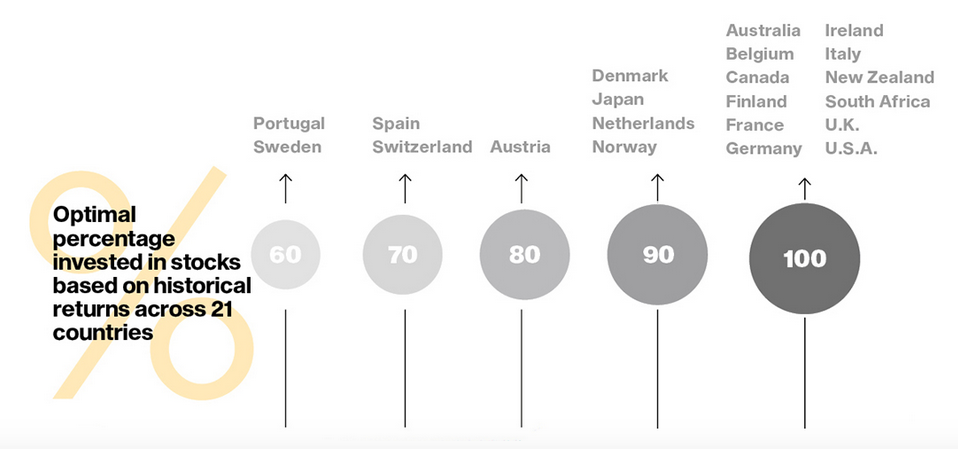
Historical: The study’s dataset includes over a century’s worth of annual returns for both stocks and bonds — from 1900 to 2014 for 21 countries and the world market. The authors use the data to analyze portfolios containing different allocations of stocks and bonds, over 30-year periods, with an initial withdrawal rate of 4 percent (which is then adjusted annually for inflation) and annual portfolio rebalancing (to maintain the specified stock-bond mix). Even after adding an extra punishment for failure to their framework, the results present a strong argument for aggressive strategies: on average, across all countries studied, the optimal portfolio had 91 percent invested in stocks and just 9 percent in bonds.
What’s more, in over half of the markets — including the United States and the worldwide average — a full 100 percent in stocks was the winning strategy in the end, based on historic returns. Meanwhile, in Spain, for example, it was better for retirees to maintain 70 percent in stocks and 30 in bonds. “We report results across many countries in order to provide a broad perspective and to show how results differ based on different market conditions,” the coauthors explain. (See figure below.)
Simulation: Of course, past performances are no guarantee of future returns, so the co-authors turn to simulations. In particular, they tested scenarios in which stock returns are lower than the historic returns (which had averaged 6 percent for the U.S. historically). They also explored varying volatility rates (which had averaged 18 percent for the U.S. historically). These simulations suggest that going heavy on stocks, lighter on bonds is still likely to be a good strategy over retirement for many. But they also find that higher volatility and lower returns for stocks will validate the conventional wisdom that bonds are good for retirees’ portfolios. (See figure below.)

In sum, using the coverage ratio (and adjusting for the pain of failure) can provide retirees a fuller picture of potential investment strategies. The authors’ approach could also be used to determine the best rate of withdrawals during retirement, or how to allocate investments before retirement, contributing to better informed investment decisions across a lifetime of wealth management.
Methodology, very briefly
The authors develop a new approach for analyzing retirement investment strategies which consists of a new measure, the coverage ratio, as well as a “kinked utility function” to adjust for the pain of failure. The authors test their framework for 11 possible investment strategies across 22 markets (21 countries and the world market), for a 114-year period between 1900 and 2014, and determine optimal stock-bond allocation for the period, on average. They also use Monte Carlo simulation to test this approach across more variables, by generating simulations for different stock returns and volatility levels.