

The Secular Decline In US Employment Over Past Two Decades – Analysis
By VoxEU.org
The employment rate among non-elderly adults in the US remains low by historical standards and in comparison to other rich countries. This column reviews the evidence on the main causes of the secular decline in employment since the turn of the century. Labour demand factors – notably import competition from China and the rise of industrial robots – emerge as the key drivers. Some labour supply and institutional factors also have contributed to the decline, but to a lesser extent.
By Katharine G. Abraham and Melissa Kearney*
Despite the cyclical recovery, the employment rate among non-elderly adults in the US – 60.3% as of August 2018 – remains low by historical standards and in comparison to other rich countries. This reflects a secular downward trend in employment that began decades ago for men, and about two decades ago for women. Explanations for this decline abound, including declines in manufacturing employment due to global competition and automation (e.g. Charles et al. 2018), growing reliance on the social safety net (Eberstadt 2016, Council of Economic Advisers 2018), and increased opioid use (Krueger 2017), among other potential factors.
In a recent paper (Abraham and Kearney 2018), we have evaluated the evidence about the main causes of the secular decline in US employment between 1999 and 2016.1 We first establish the importance of within-group employment rate declines in driving the overall reduction, then consider a wide set of potential explanatory factors for the long-term downward trend. These are the structural issues that will need to be confronted if the decline in employment is to be reversed.
Declining employment rates for younger, less educated workers
From 1999 to 2016, the employment-to-population (e/pop) rate for the US population aged 16 and over fell from 64.3% to 59.7%, a decline of 4.5 percentage points. Although population aging has been a factor, declines in employment among those age 16 to 54 have been even more important. These declines represent a continuation of a multi-decade decline in male employment, but a marked departure from the steady rise in female employment over earlier decades. Different factors undoubtedly have been more or less important in driving employment rates over various periods. Our focus on explaining the recent experience allows us to draw policy conclusions that are relevant to the goal of increasing employment rates in the current environment.
Figures 1a and 1b plot the employment-to-population (e/pop) ratio for several different groups of nonelderly adults. As can be seen in the figures, for both men and women, the employment rate for each 10-year age group between 25 and 54 fell between 1999 and 2016, as did that for those age 16 to 24. In contrast, employment increased among individuals age 55 to 64, as well as among those age 65 and older (not shown in the figure). Breaking the data out by education (not shown), those with a high school degree or some college experienced the largest declines, more so than those with less than a high school degree or with a college degree.2
Figure 1 Employment by age group
a) Men
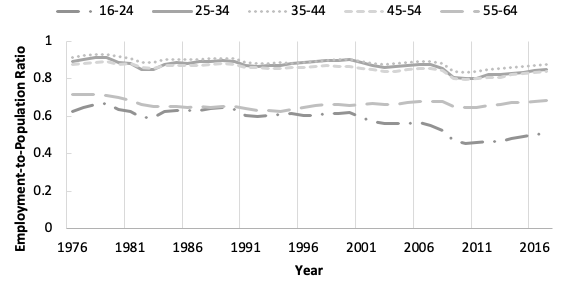
b) Women
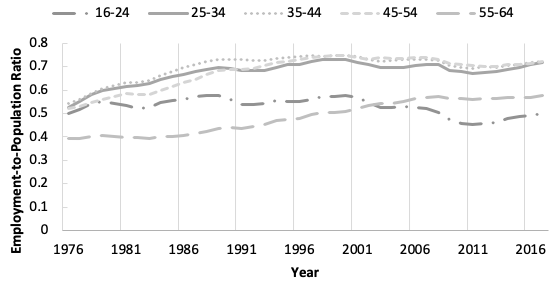
Source: IPUMS-CPS.
Note: Each value shown is a 12-month average across the Jan-Dec CPS for a given year.
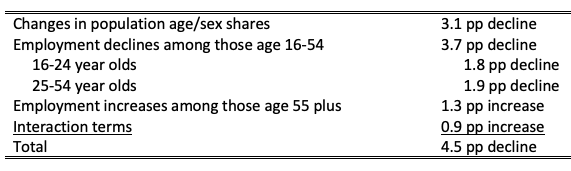
We decomposed the overall e/pop decline among all adults aged 16 and over into changes due to shifts in population composition versus shifts in the employment rate within age-sex groups.3 Decreases in within-group employment rates among those aged 16 to 54 can account for 80.8% of the net overall decline in the employment-to-population ratio. Population ageing also made a significant contribution, but less than it might have given that those aged 55 and older have actually experienced increases in their employment rates over this period.
Table 1 Decomposition of e/pop decline from 1999 to 2016
Explaining the decline: A ranking of the factors
Our critical review of the evidence put forward in over 150 studies identifies labour demand factors as key drivers of the decline in employment between 1999 and 2016. Some labour supply and institutional factors also have contributed to the decline, though to a lesser extent. Table 2 summarises our estimates of how much each factor whose effect we were able to quantify at least roughly contributed to the overall 4.5 percentage point decline in the employment-population ratio over our period.4
Table 2 Factors contributing to decline in employment-to-population ratio from 1999 to 2016
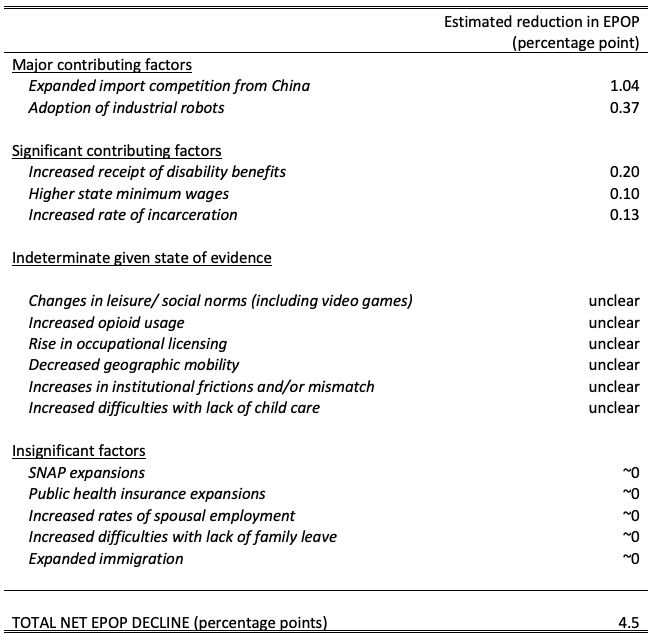
Among the effects for which we were able to construct an estimate, increased import competition from China is the single largest contributing factor to the decline in employment. A great deal of empirical evidence links import competition from China to the decline in manufacturing employment.5 These import pressures also had negative employment effects on ‘upstream’ intermediate goods industries, as well as other non-manufacturing industries (Acemoglu et al. 2016, Autor et al. 2015). Estimates from Acemoglu et al. (2016) are the basis for our estimate that the 302% increase in Chinese imports (measured in 2007 US dollars) from 1999 to 2016 led to displacement of approximately 2.65 million workers, a 1.04 percentage point shift in the employment-population ratio.
The employment effects from industrial robots are most clearly documented by Acemoglu and Restrepo (2017), who find that each additional robot per thousand workers between 1993 and 2007 reduced employment by 5.6 workers. This estimate implies that the rise in the stock of robots between 2007 and 2016 displaced 0.95 million workers, equivalent to a 0.37 percentage point decline in the employment-to-population ratio.Although improvements in computing technology have been if anything even more ubiquitous, Autor et al. (2015) find that competition from computing technology affects only routine task-intensive occupations, and that any employment losses in those occupations were offset by employment gains in abstract and manual task-intensive occupations.
Labour supply factors as a group have been considerably less important than labour demand factors in driving the decline in employment.The claim that expanded safety net support through SNAP (food stamps) or Medicaid led to sizable decreases in employment is hard to square with either the institutional features of these programmes or the evidence on causal linkages. Careful work finds little to no labour supply effects of these programmes, and as a practical matter, they offer very little by way of income support to able-bodied childless adults (see, for example, Hoynes and Schanzenbach 2016 on SNAP, and Leung and Mas 2016 on Medicaid.)
That said, the availability of lifelong disability insurance benefits through the Social Security Disability Insurance (SSDI) programme and the Veterans Affairs Disability Compensation (VADC) programme has contributed modestly to falling employment rates. Applying age-group specific causal labour supply estimates from Maestes et al. (2013) to the growth in the SSDI caseload over and above that due to the population becoming older yields an estimated 0.14 percentage point decline in the e/pop ratio over our time period owing to growth in this programme. Applying the labour supply elasticity from a recent study of an exogenous policy change to VADC program eligibility (Autor et al. 2016) to an estimate of the excess VADC caseload implies that programme’s growth led to an e/pop decline of perhaps 0.06 percentage points.
One might expect the tremendous rise in incarceration in the US to have been a significant driver of declining employment, but because so many incarcerated individuals had low levels of labour force attachment even before their prison term, we estimate only a modest aggregate effect. Applying the causal estimates from Mueller-Smith (2015) to rough estimates of the number of former prisoners by length of time served and prior earnings history, our very rough estimate is that perhaps 0.13 percentage points of the decline in e/pop between 1999 and 2016 can be attributed to policy-induced increases in incarceration. Minimum wage increases probably also had a small but non-negligible impact, especially among younger, less-skilled workers. Taking account of the range of estimates produced by credible study designs, we estimate that increases in state and local minimum wages might have contributed 0.10 percentage points to the e/pop decline.
Other plausible factors driving the decline in employment are the sharp rise in occupational licensing (Kleiner and Krueger 2013), the decline in geographic mobility (Molloy et al. 2011), and increased difficulties securing affordable, high-quality child care. We do not attempt to assign a magnitude to these factors because we lack sufficient evidence to establish the causal impact of these factors or, in the case of child care, to assess how much the factor itself has changed. Another open question is to what extent anecdotes about worsening mismatch between the skills workers possess and those that employers need are borne out in the data.
Scholars have noted the connection of both increased leisure time (including time playing video games) (Aguiar et al. 2017) and increased opioid use (Krueger 2017, Currie et al. 2018) with non-employment, but whether one is causing the other or vice versa, or they are all manifestations of other societal changes, is not easy to disentangle.
Policy implications
Our findings about the factors that have driven the decline in employment over recent decades lead us to conclude that, while the positive effects of the cyclical recovery certainly have been welcome, a reversal of the secular decline in US employment rates will require a multi-faceted policy approach. Addressing the dis-employment effects of trade and technology will require expanded and enhanced opportunities for training and skill development to enable affected workers to be re-employed in new sectors. In addition, programmatic reforms to disability insurance programmes that focus on early intervention to help people get back to work before they enrol hold promise, as do changes in the existing program to allow those with less severe disabilities to combine work and benefit receipt. Increased take-home pay for low-wage workers through an expanded EITC and/or a secondary earner tax deduction likely would lead to modest increases in employment rates and, importantly, increased economic security among less-skilled workers. Just as the reasons for the employment decline have been varied and multi-faceted, an effective policy response will be as well.
*About the authors:
Katharine G. Abraham, Professor of Economics and Survey Methodology, University of Maryland
Melissa Kearney, Neil Moskowitz Professor of Economics, University of Marylan
References:
Abraham, K G and M S Kearney (2018), “Explaining the Decline in the U.S. Employment to Population Ratio: A Review of the Evidence”, NBER Working Paper 24333.
Acemoglu, D, D Autor, D Dorn, G H Hanson, and B Price (2016), “Import Competition and the Great US Employment Sag of the 2000s”, Journal of Labor Economics 34(S1): S141-S198.
Acemoglu, D and P Restrepo (2017), “Robots and Jobs: Evidence from US Labor Markets”, NBER Working Paper 23285.
Aguiar, M, M Bils, K Charles and E Hurst (2017), “Leisure Luxuries and the Labor Supply of Young Men”, NBER Working Paper No. 23552.
Autor, D H, D Dorn, and G H Hanson (2013), “The China Syndrome: Local Labor Market Effects of Import Competition in the United States,” American Economic Review 103: 2121-68.
Autor, D H, D Dorn, and G H Hanson (2015), “Untangling Trade and Technology: Evidence from Local Labor Markets”, The Economic Journal 125(584): 621-646.
Autor, D, D Dorn, G Hanson, and J Song (2014), “Trade Adjustment: Worker Level Evidence,” Quarterly Journal of Economics 129(4): 1799-1860.
Autor, D, M Duggan, K Greenberg, and D S Lyle (2016), “The Impact of Disability Benefits on Labor Supply: Evidence from the VA’s Disability Compensation Program,” American Economic Journal: Applied Economics 8(3): 31-68.
Bernard, A, J B Jensen, and P Schott (2006), “Survival of the Best Fit: Exposure to Low-Wage Countries and the (Uneven) Growth of U.S. Manufacturing Plants,” Journal of International Economics 68(1): 219-237.
Charles, K K, E Hurst and M J Notowidigdo (2016), “The Masking of Declining Manufacturing Employment by the Housing Bubble,” Journal of Economic Perspectives 30(2): 179-200.
Charles, K, E Hurst, and M Schwartz. (2018), “The Transformation of Manufacturing and the Decline in U.S. Employment”, NBER Working Paper 24468.
Currie, J, J Jin, and M Schnell (2018), “U.S. Employment and Opioids: Is There a Connection?” NBER Working Paper 24440.
Council of Economic Advisers (2018), “Expanding Work Requirements in Noncash Welfare Programs”.
Eberstadt, N (2016), Men without Work. West Conshohocken, PA: Templeton Press.
Hoynes, H W and D W Schanzenbach (2016), “U.S. Food and Nutrition Programs,” in R Moffitt (ed.), Economics of Means-Tested Transfer Programs in the United States, Chicago: University of Chicago Press, 219–301.
Kleiner, M M, and A B Krueger (2013), “Analyzing the Extent and Influence of Occupational Licensing on the Labor Market”, Journal of Labor Economics 31(S1): S173-S202.
Krueger, A B (2017), “Where Have All the Workers Gone? An Inquiry into the Decline of the U.S. Labor Force Participation Rate,” Brookings Papers on Economic Activity, Fall, 1-87.
Leung, P, and A Mas (2016), “Employment Effects of the ACA Medicaid Expansions,” NBER Working Paper 22540.
Maestas, N, K J Mullen, and A Strand (2013),”Does Disability Insurance Receipt Discourage Work? Using Examiner Assignment to Estimate Causal Effects of SSDI Receipt”, American Economic Review 103(5): 1797-1829.
Molloy, R, C L Smith, and A Wozniak (2011), “Internal Migration in the United States,” Journal of Economic Perspectives 25(3): 173–196.
Mueller-Smith, M (2015), “The Criminal and Labor Market Impacts of Incarceration,” University of Michigan, unpublished working paper.
Pierce, J R and P K Schott (2016),”The Surprisingly Swift Decline of US Manufacturing Employment,” American Economic Review 106(7): 1632-62.
Endnotes:
[1] Some of the numbers in this column reflect updates we have made to our calculations in light of new evidence and feedback we have received since the circulation of our paper.
[2] For instance, the employment rate for those age 25 to 34 with a high school degree fell 8.3 percentage points, from 79.7 to 71.4; the decline was 9.6 percentage points for men and 8.9 percentage points for women.
[3] Age groups used for the decomposition are 16-19, 20-24, 25-29, 30-34, 35-39, 40-44, 45-49, 50-54, 55-59, 60-64, 65-69, 70-74, and 75+ years.
[4] Some of these estimates differ slightly from the numbers reported in Abraham and Kearney (2018), reflecting updates made since the working paper release. All of these numbers should be taken as rough estimates, with substantial uncertainty around all of the specific numbers.
[5] See, for example, Charles et al. (2016), Autor et al. (2013, 2014); Bernard et al. (2006), Pierce and Schott (2016).