
Sustained Low Oil Prices Could Reduce Exploration And Production Investment – Analysis
By EIA
Low oil prices, if sustained, could mark the beginning of a long-term drop in upstream investment. Oil prices reflect supply and demand balances, with increasing prices often suggesting a need for greater supply. Greater supply, in turn, typically requires increased investment in exploration and production (E&P) activities. Lower prices reduce investment activity.
Overlaying annual averages of the domestic first purchase price (in real terms) on oil and gas investment reveals that upstream investment is highly sensitive to changes in oil prices (Figure 1). Given the fall in oil prices that began in mid-2014 and the relationship between oil prices and upstream investment, it is possible that investment levels over the next several years will be significantly lower than the previous 10-year annual average.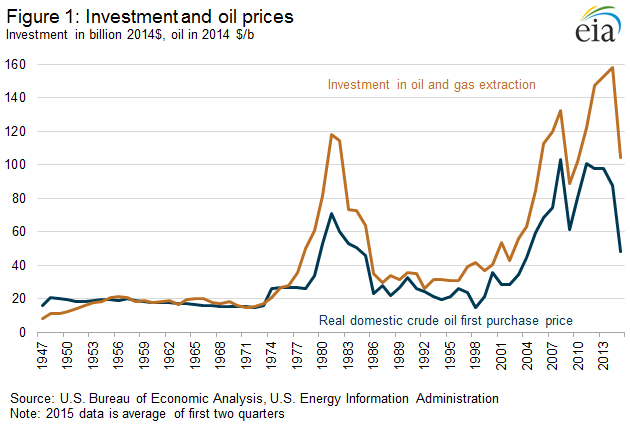
Oil production is a capital-intensive industry that requires management of existing production assets and evaluation of prospective projects often requiring years of upfront investment spending on exploration, appraisal, and development before reserves are developed and produced.
Previous investment cycles provide insights to how investment responds to crude oil price changes. In 1981 and 1982, after crude oil prices significantly increased, investment topped out at more than $100 billion (in 2014 dollars) and then averaged $30 billion to $40 billion per year into the early 2000s as crude oil prices fell and remained in the $20-$30 per barrel (b) range. From 2003 to 2014, investment spending increased from $56 billion to a high of $158 billion as crude oil prices increased from $34.53/b to $87.39/b, including several months of prices reaching over $100/b. EIA’s 2015 Annual Energy Outlook Reference case projects real domestic first purchase prices to average about $70/b in 2020. This could result in substantially lower annual oil and gas investment over the 2015-20 period than the annual average of $122 billion spent during the 2005-14 investment cycle crest.
Oil and gas investment represented 1% of U.S. gross domestic product in 2014. The sector’s fixed assets totaled $1.5 trillion, approximately 3.8% of total U.S. private fixed assets, and the sector’s 2014 investment spending of $158 billion represented approximately 5.7% of total U.S. private investment in fixed assets. During the high point of prices in 2012-14, when real U.S. oil prices averaged $94.20/b, oil and gas sector fixed asset investment totaled $458 billion, or 5.8% of U.S. private fixed asset investment over the three-year period. During a comparable period of high oil prices (1980-82), oil and gas fixed asset investment was $314 billion, or 8.1% of U.S. private fixed asset investment, adjusted for inflation.
Crude oil prices are a key driver of upstream investment, but several other firm-specific factors also influence decision-making. Besides managing existing assets and maintaining and replacing property and equipment, E&P firms have a portfolio of prospective projects of varying cost, risk, and technical complexity. Portfolio reviews occur as project proposals mature at varying points of time and then go through management for approval. Among many other factors, management consideration is shaped by the financial metrics of the project, alignment with the firm’s priorities, project congruence with periodic spending reviews, and the firm’s assessment of short- and long-term commodity price, production, and consumption trends.
While E&P firms have their own future expectations, upstream investments are generally not developed solely on current commodity prices, but instead are structured to provide returns under a wide range of price outcomes. Additionally, company investment cycles cannot be easily separated into specific periods, but instead depend on specific project approvals. The sum of anticipated costs for these approved projects make up the investment plan in any given year.
U.S. average gasoline and diesel fuel prices decrease
The U.S. average retail price of regular gasoline decreased five cents from the previous week to $2.33 per gallon on September 21, $1.03 per gallon lower than the same time last year. The West Coast and Rocky Mountain prices each fell eight cents to $2.91 per gallon and $2.61 per gallon, respectively. The Gulf Coast price declined seven cents to $2.03 per gallon. The East Coast price decreased five cents to $2.20 per gallon, and the Midwest price was down one cent to $2.27 per gallon.
The U.S. average price for diesel fuel fell three cents from last week to $2.49 per gallon, $1.29 per gallon lower than during the same time last year. The Rocky Mountain and East Coast prices each decreased three cents to $2.52 per gallon and $2.55 per gallon, respectively. The Midwest, Gulf Coast, and West Coast prices all declined two cents to $2.45 per gallon, $2.34 per gallon, and $2.71 per gallon, respectively.
Propane inventories fall
U.S. propane stocks decreased by 0.6 million barrels last week to 97.1 million barrels as of September 18, 2015, 18.0 million barrels (22.7%) higher than a year ago. Gulf Coast inventories decreased by 0.6 million barrels and Midwest inventories decreased by 0.3 million barrels. Rocky Mountain/West Coast inventories increased by 0.2 million barrels and East Coast inventories increased by 0.1 million barrels. Propylene non-fuel-use inventories represented 4.7% of total propane inventories.